Infographics
Sea of Life
Year
2023
Category
Data Visualisation
Medium
Quantitative Visualisation
Location
New York, USA
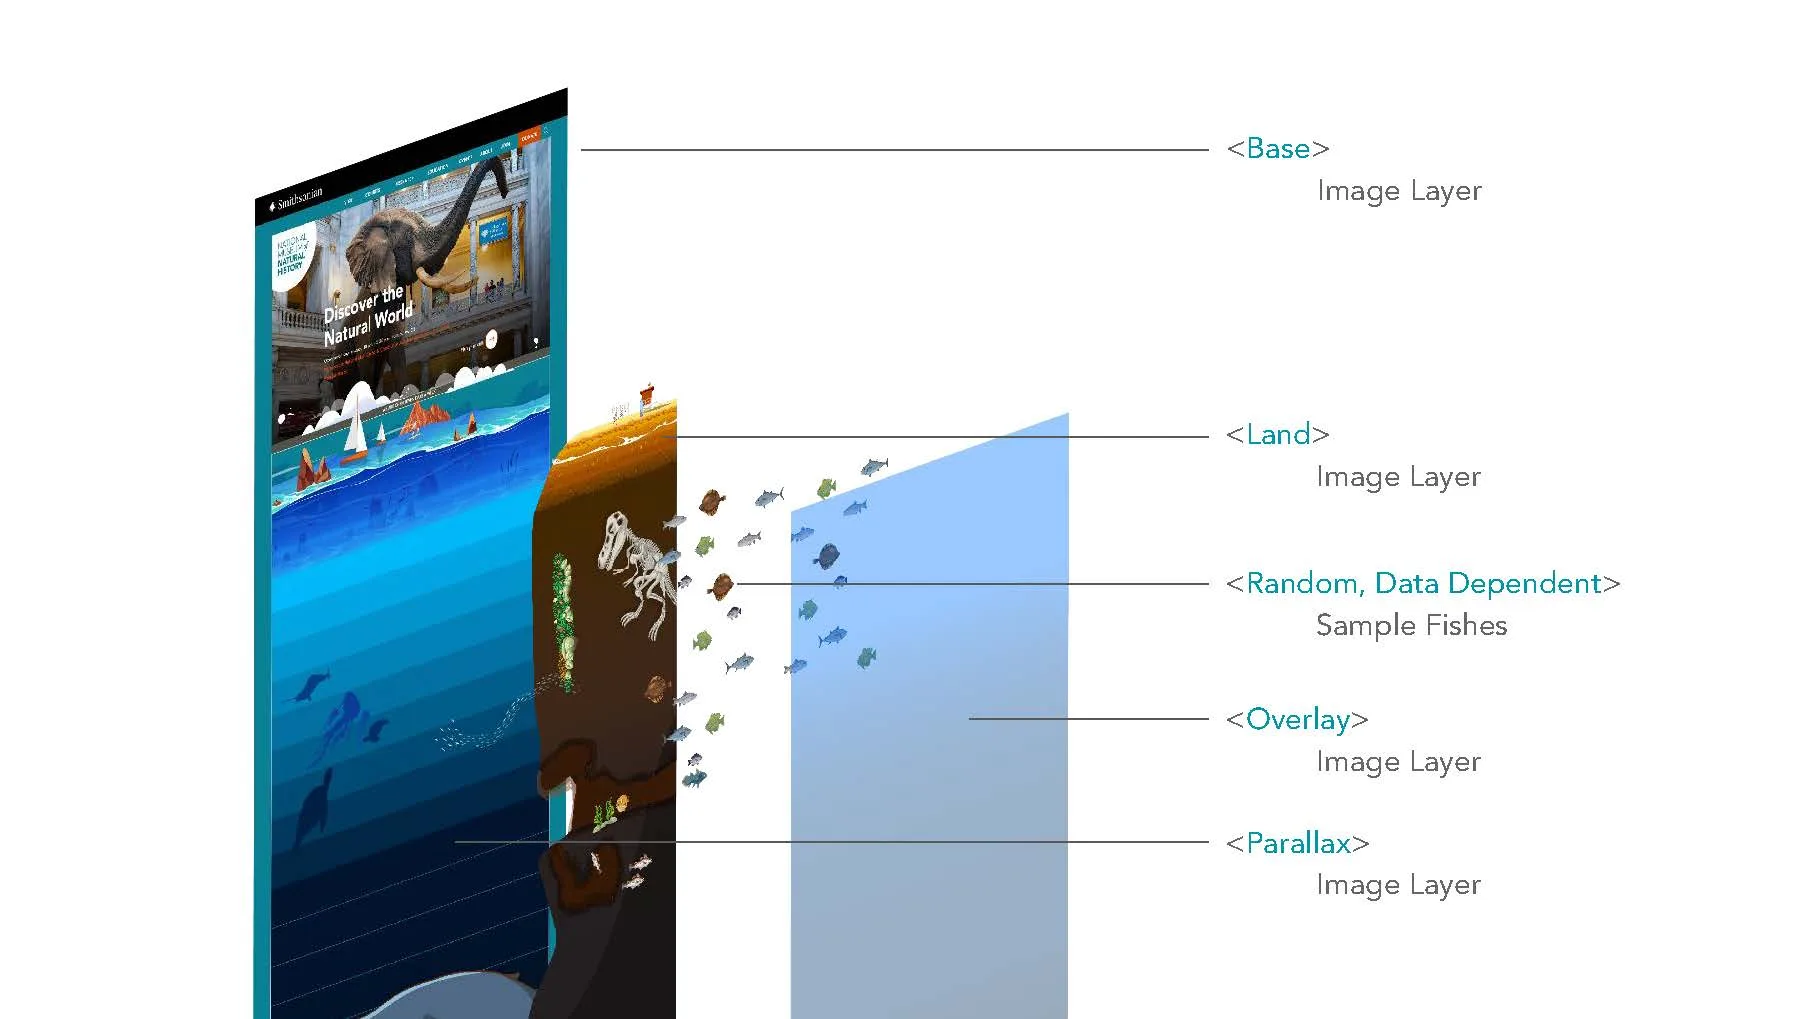
A quantitative visualisation of fish biodiversity drawn from the Smithsonian Institution's natural history collections. The work explores taxonomic distribution, habitat ranges, and collection density — rendering the ocean's extraordinary diversity as a navigable sea of interlocking data, where every point represents a specimen catalogued for science.