Work
CASCADE
Data Visualisation
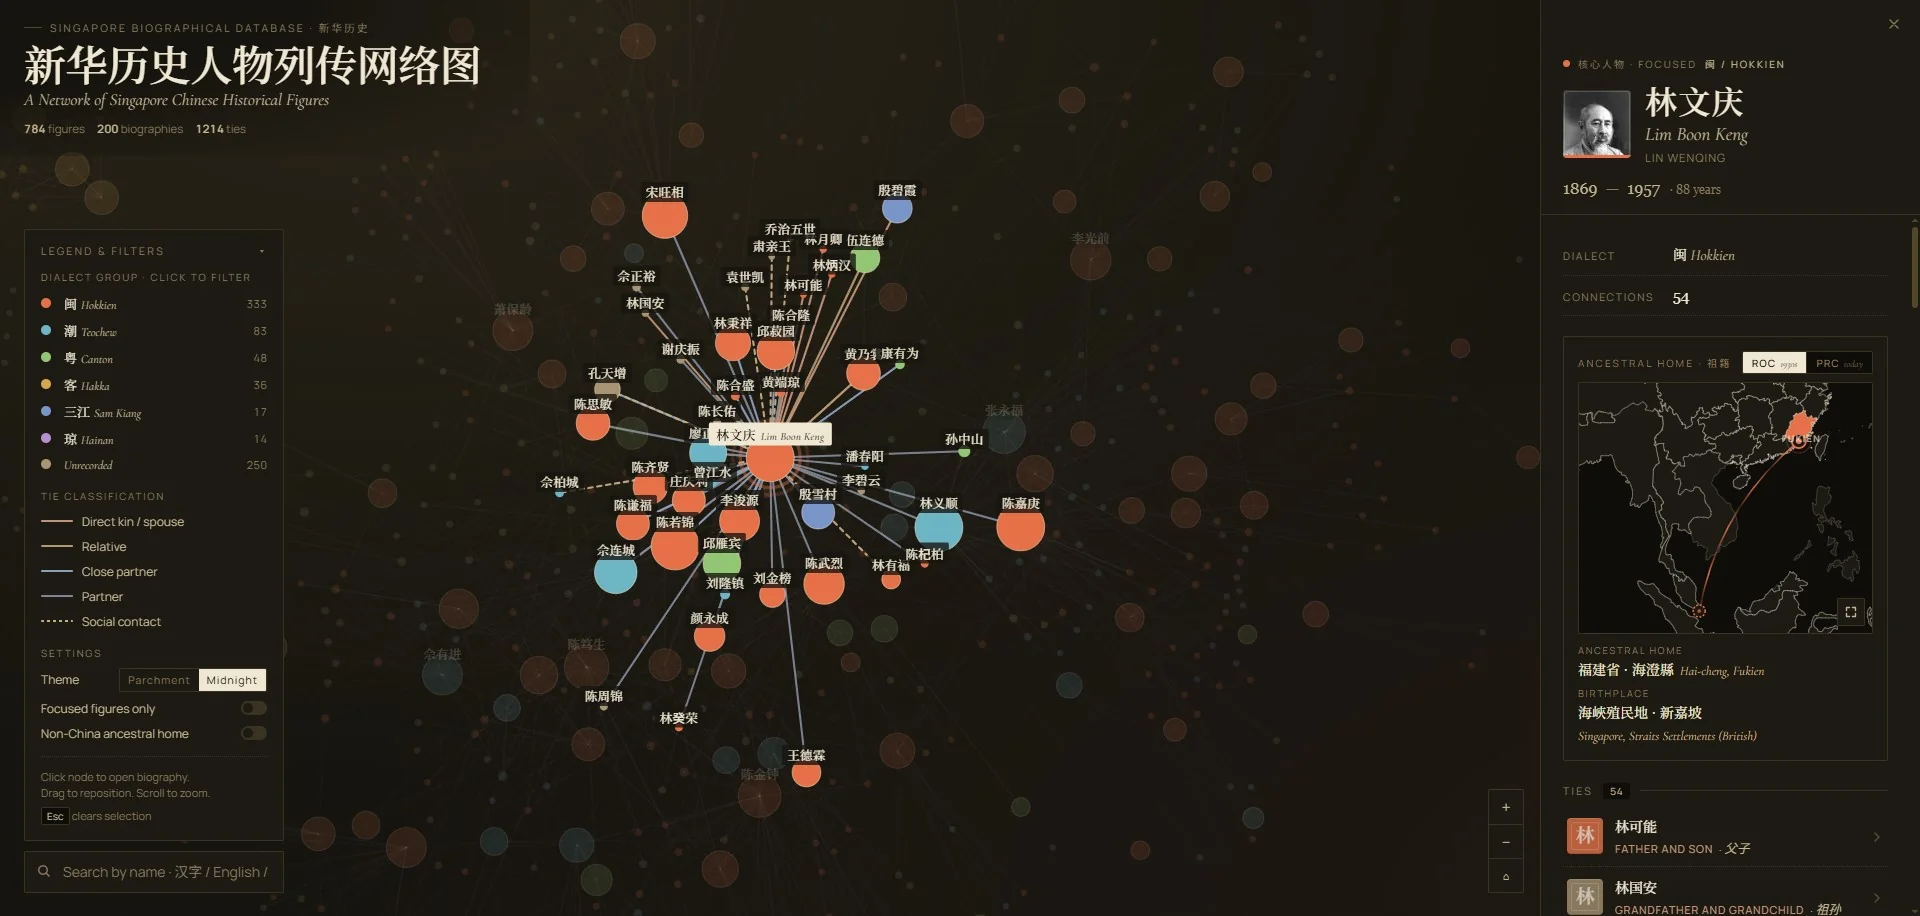
Network Visualisation / Chinese Diaspora
Singapore Chinese Historical Network
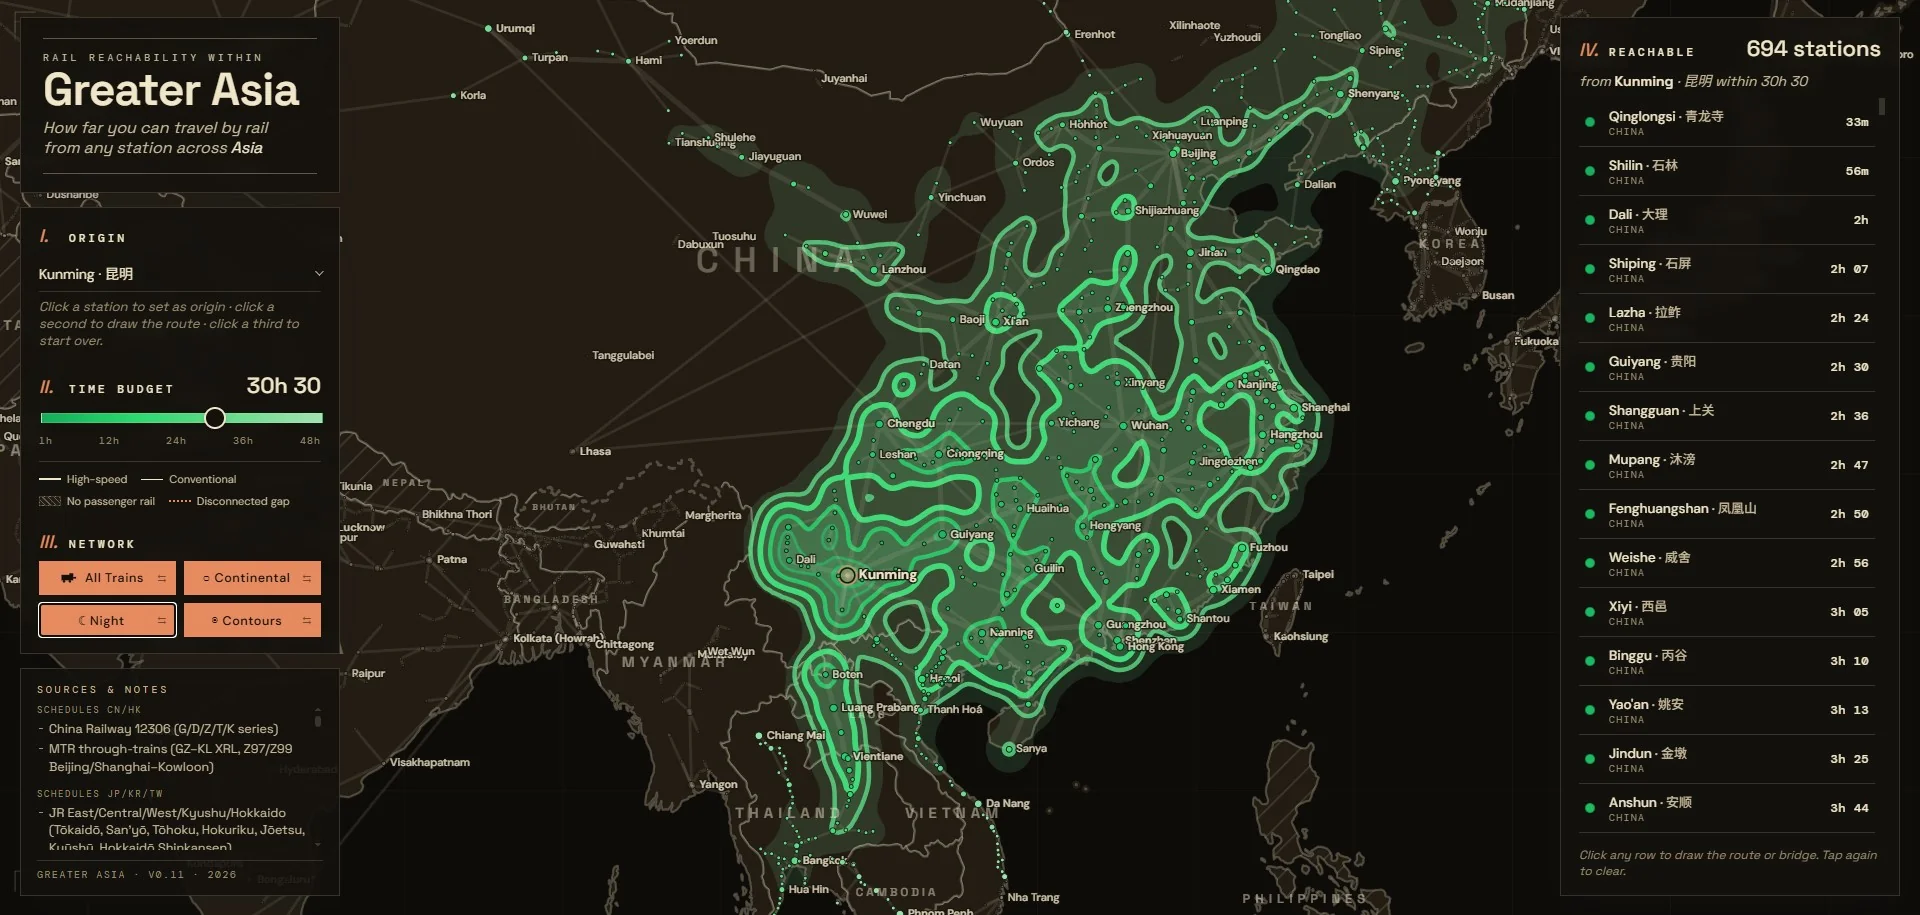
Isochrone Map / Rail Network
Greater Asia Reachability
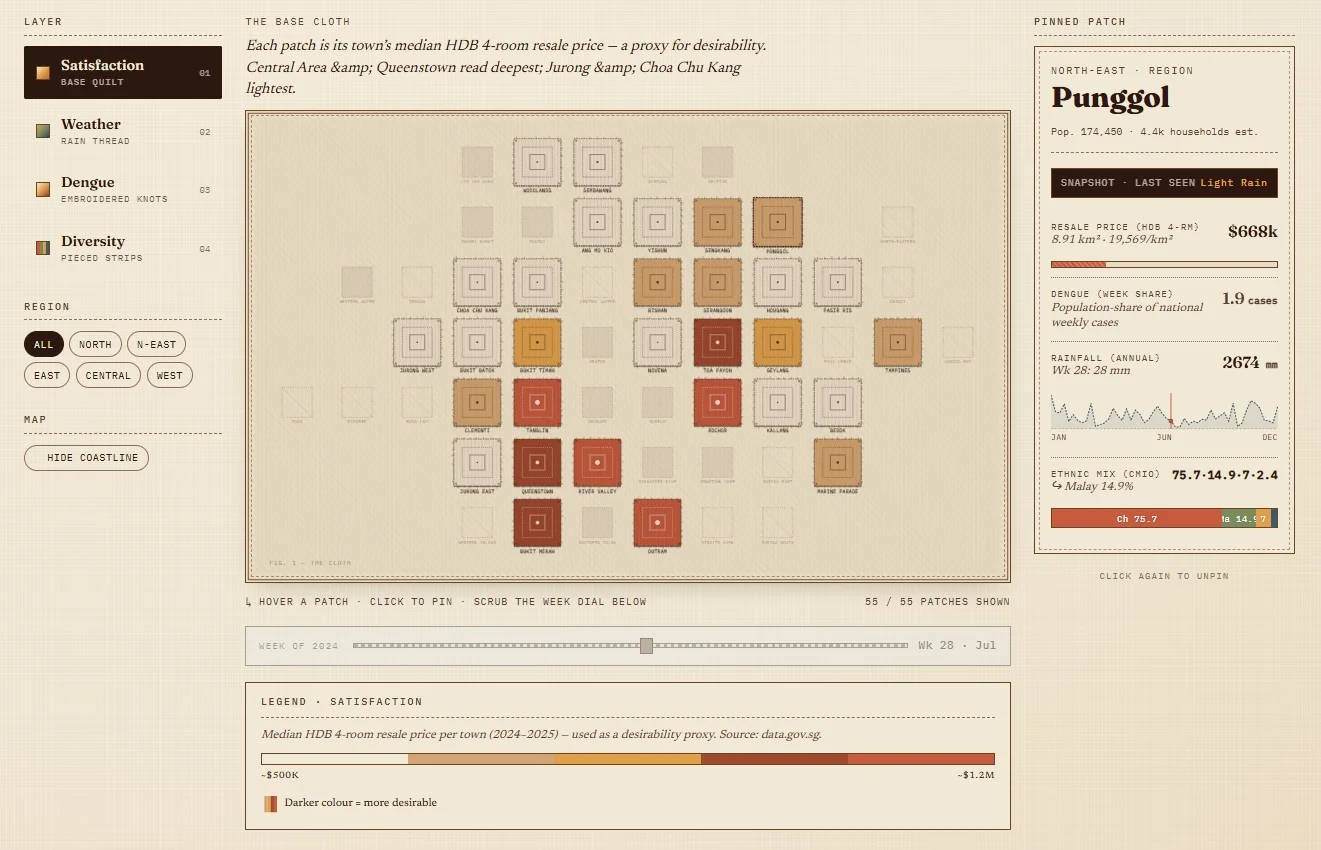
Interactive Visualisation / Open Data
Singapore Patchwork
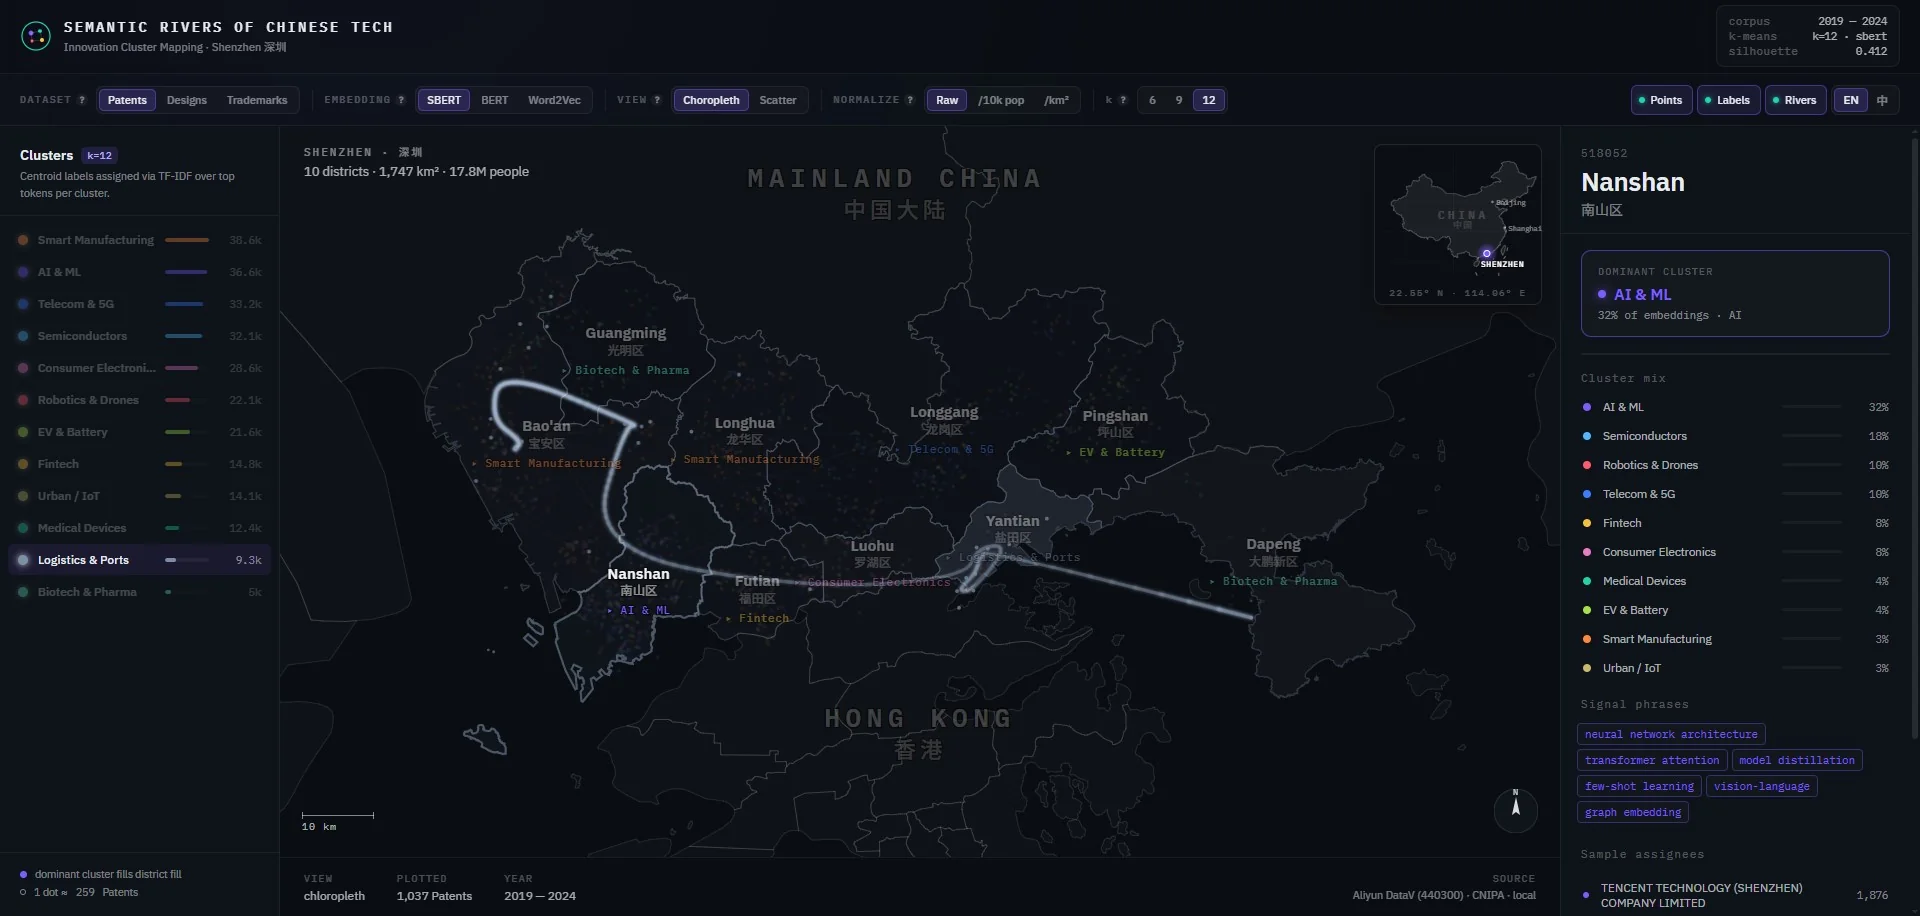
Semantic Cluster Map / Innovation Geography
Semantic Rivers of Chinese Tech
Visual Catalogue / TCM
The Herbs of Chinese Medicine
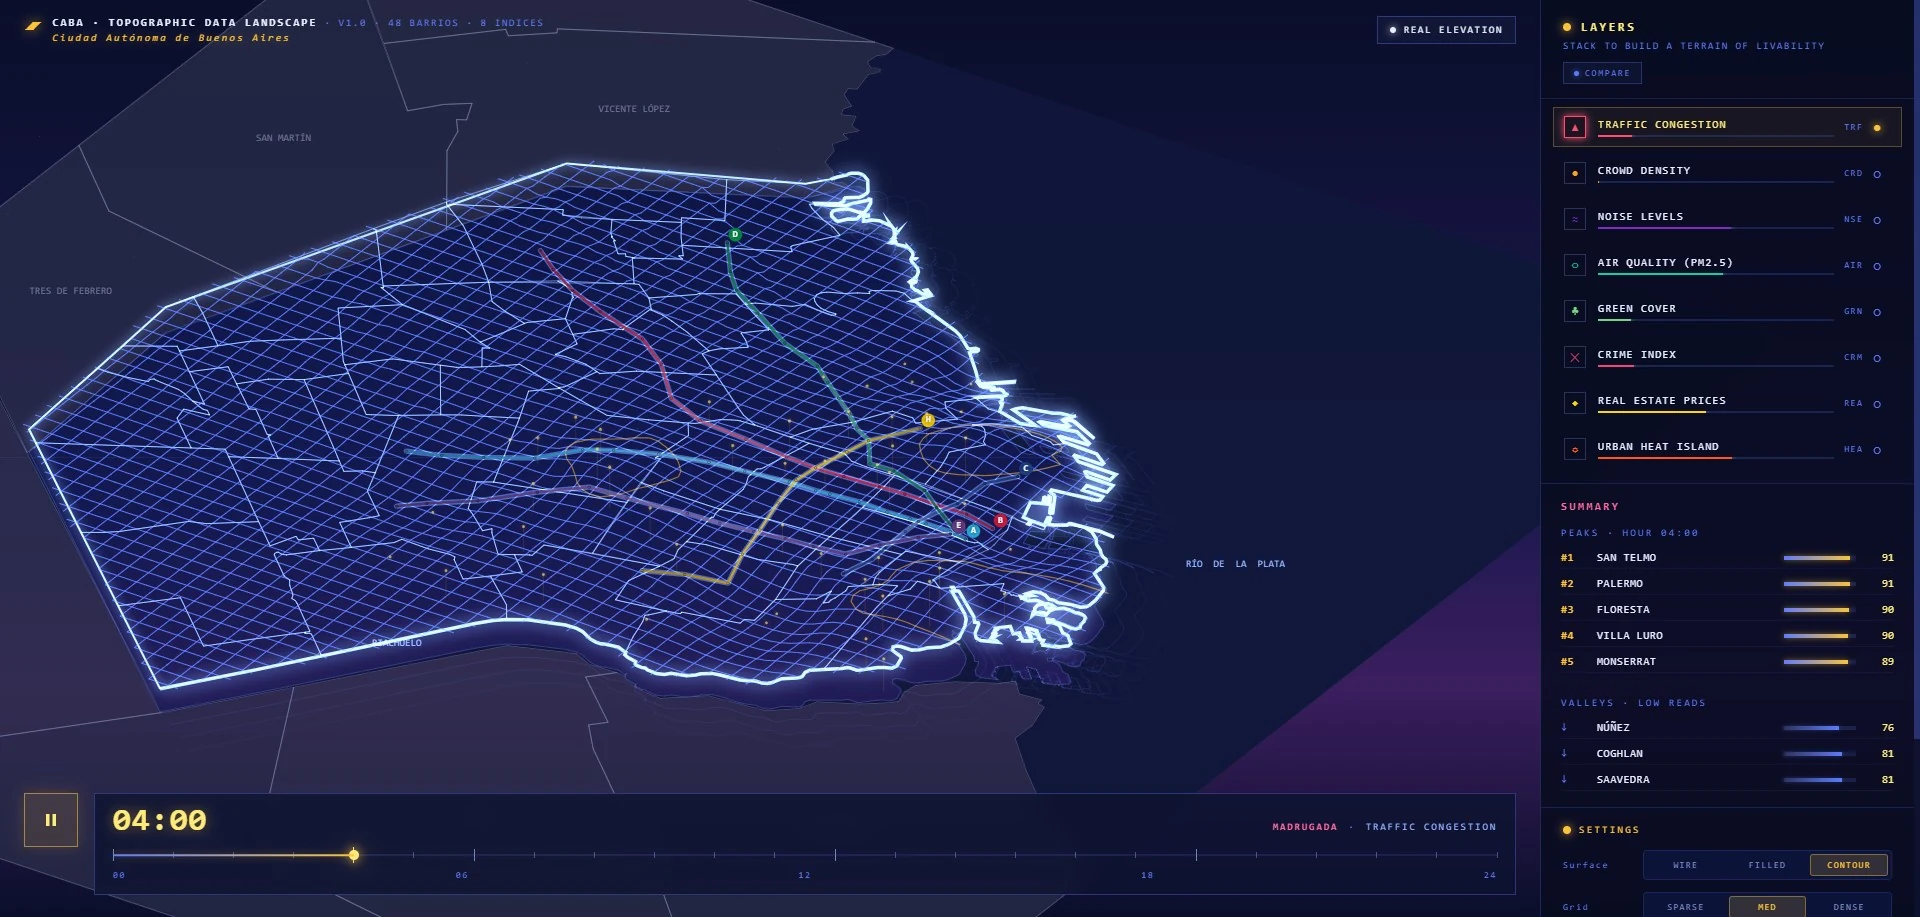
Topographic Map / Livability Index
Buenos Aires Livability Landscape
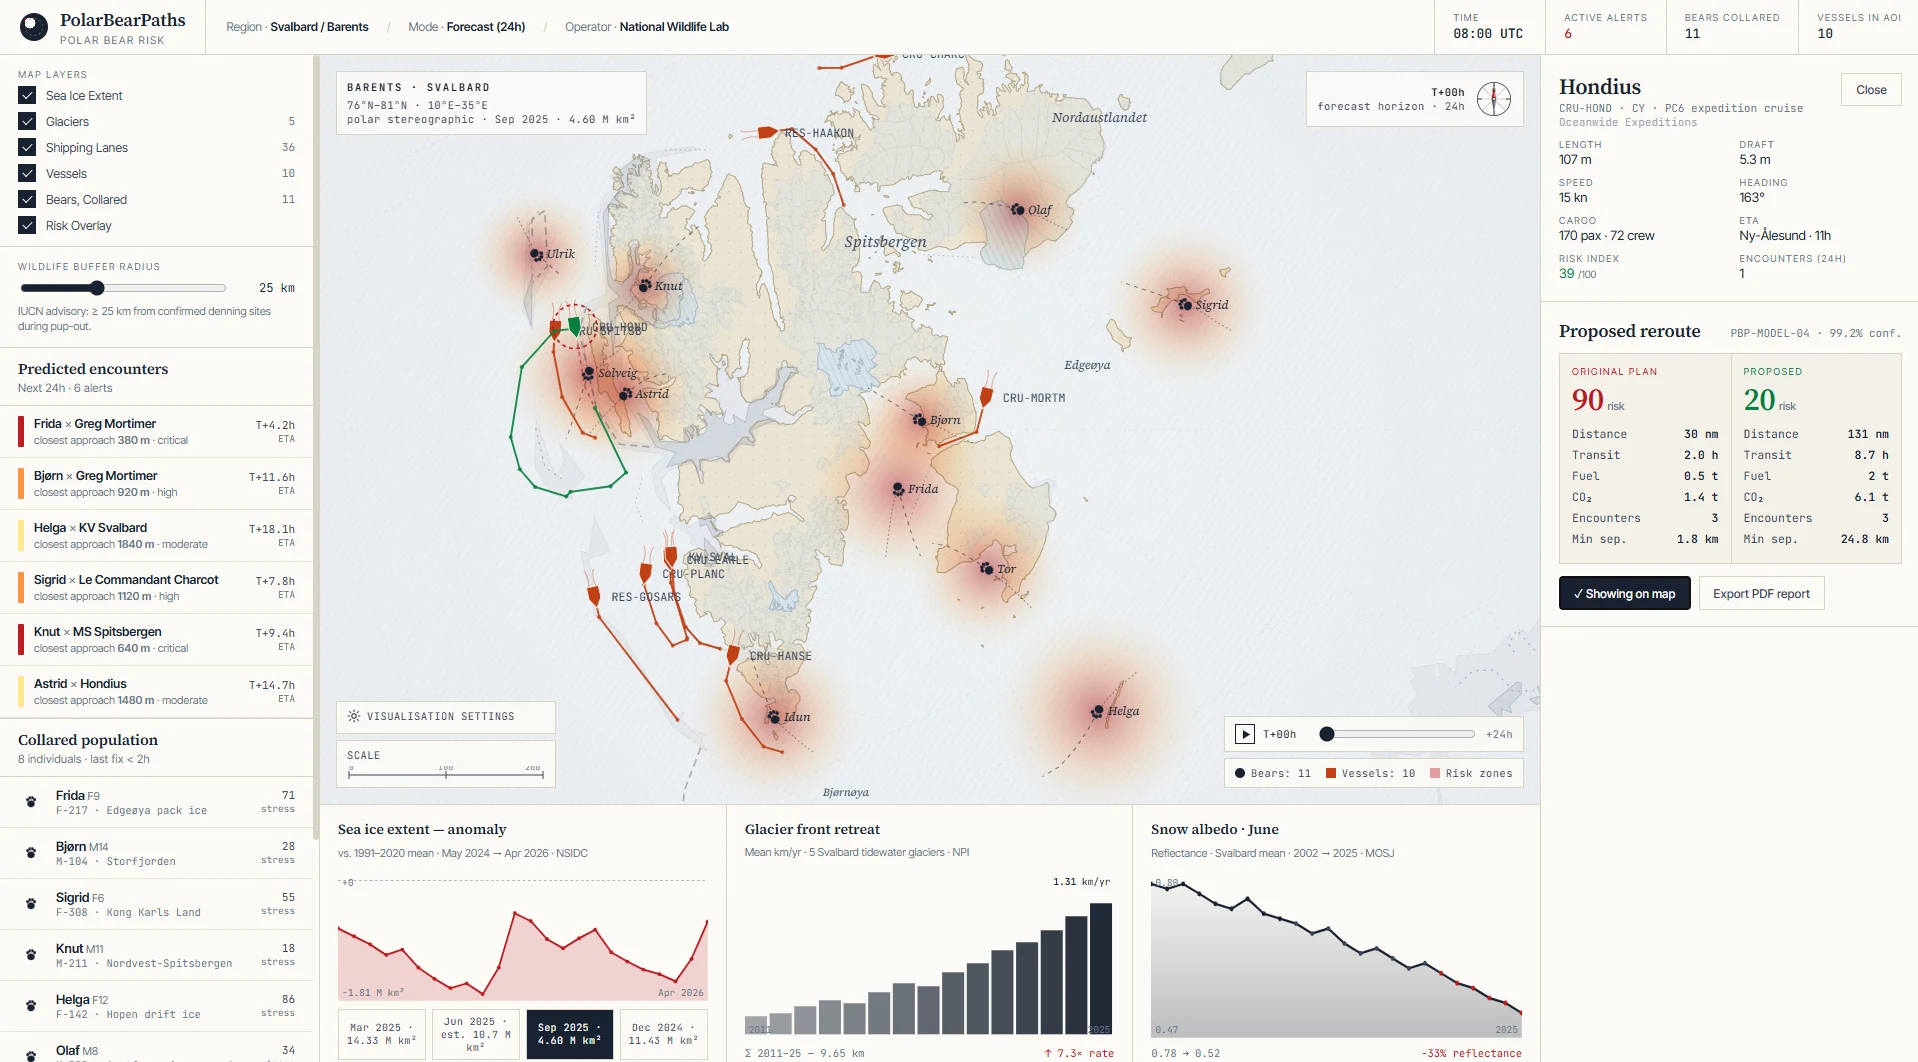
Wildlife Tracking / GIS
PolarBearPaths
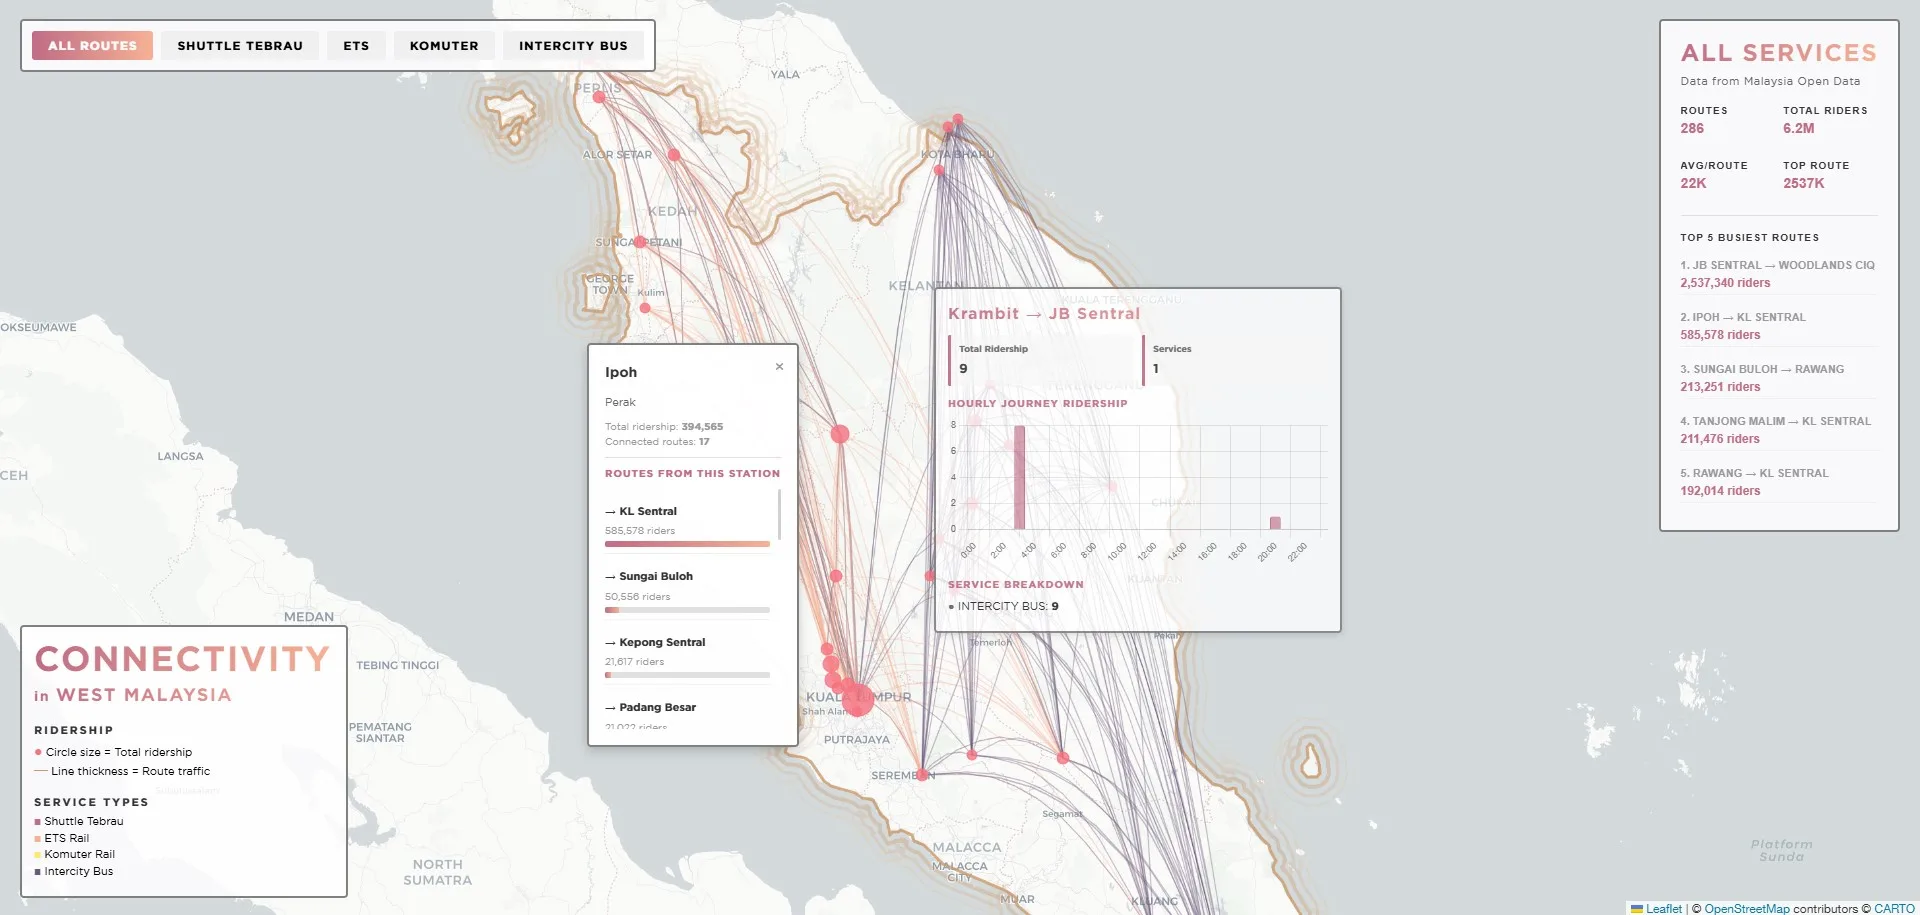
Transportation Network
Malaysian Transportation Network
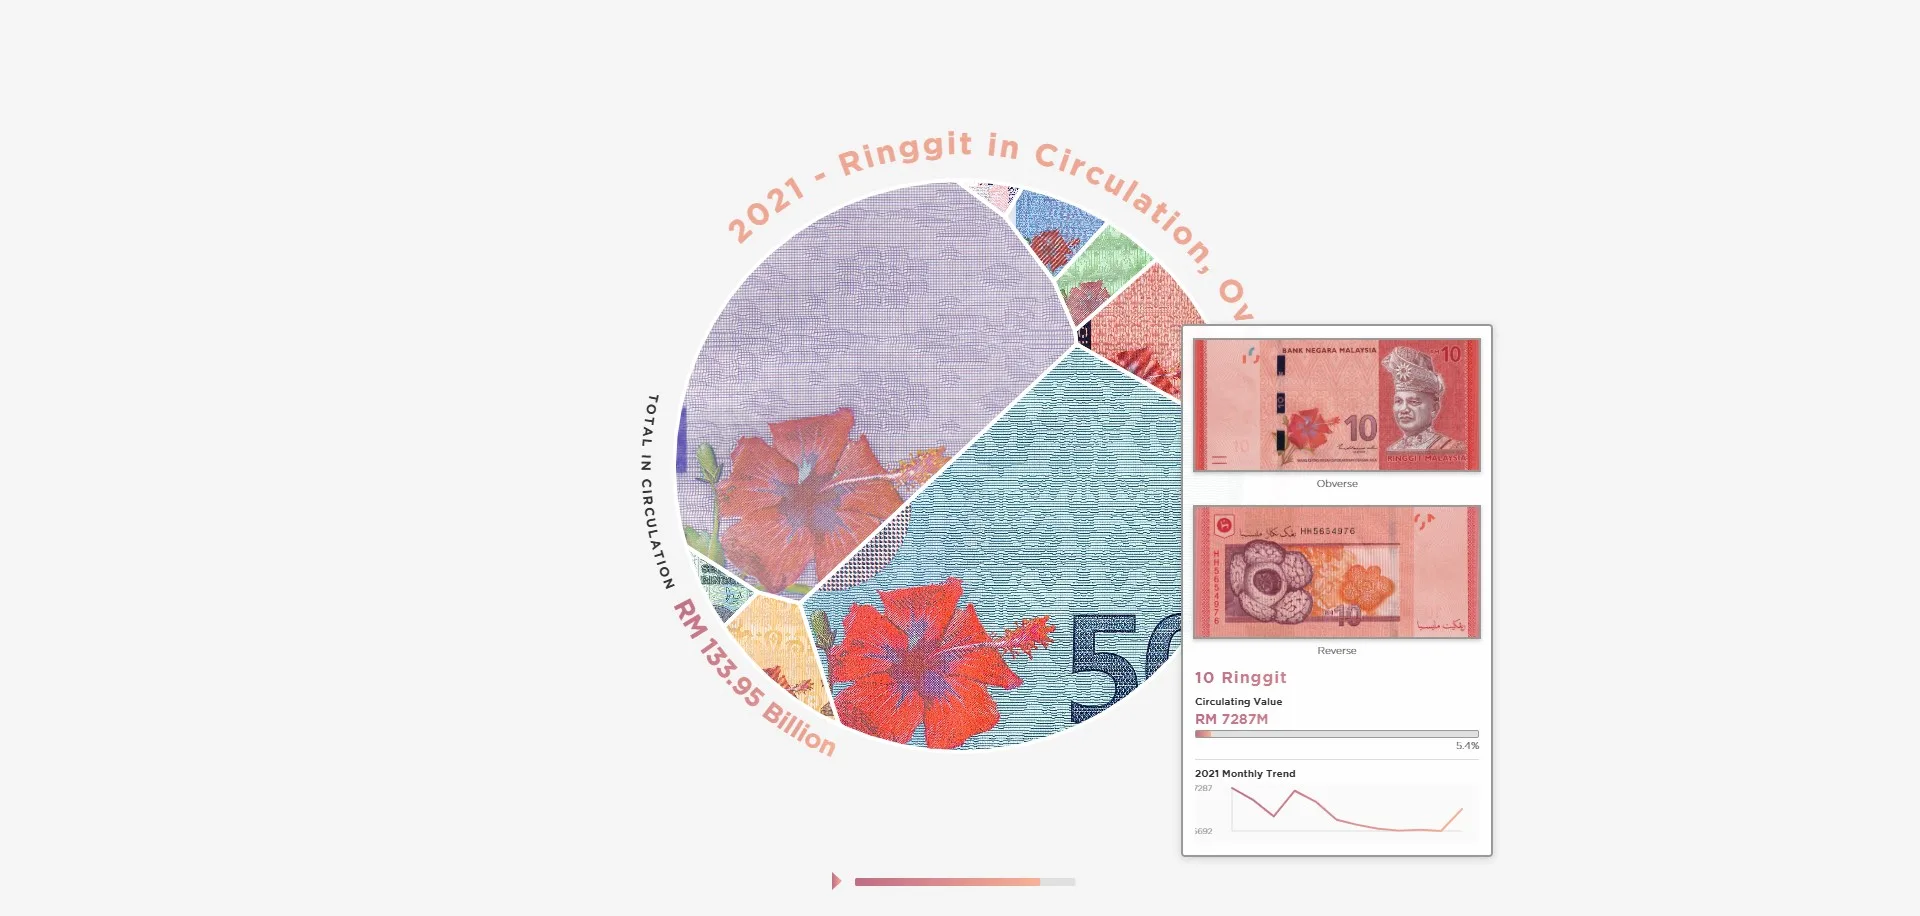
Currency / Voronoi Treemap
Ringgit in Circulation
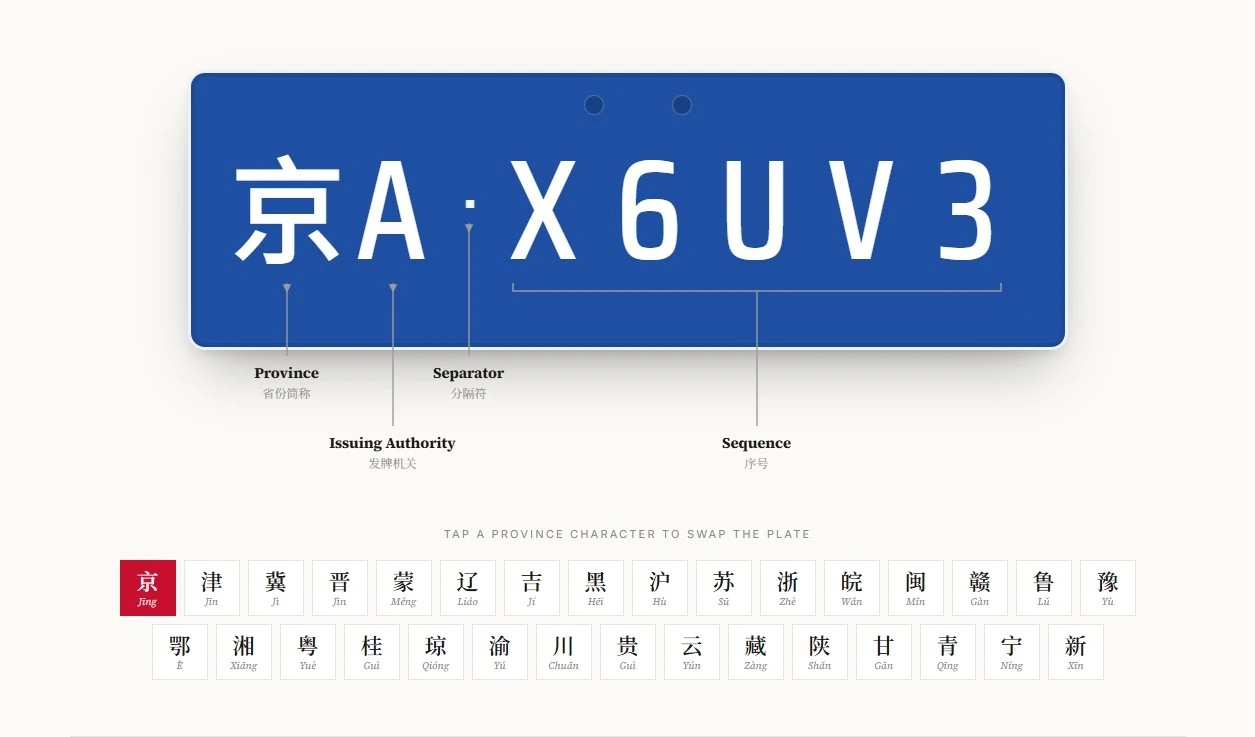
Long-form Explainer / Typography
Reading the Chinese Licence Plate
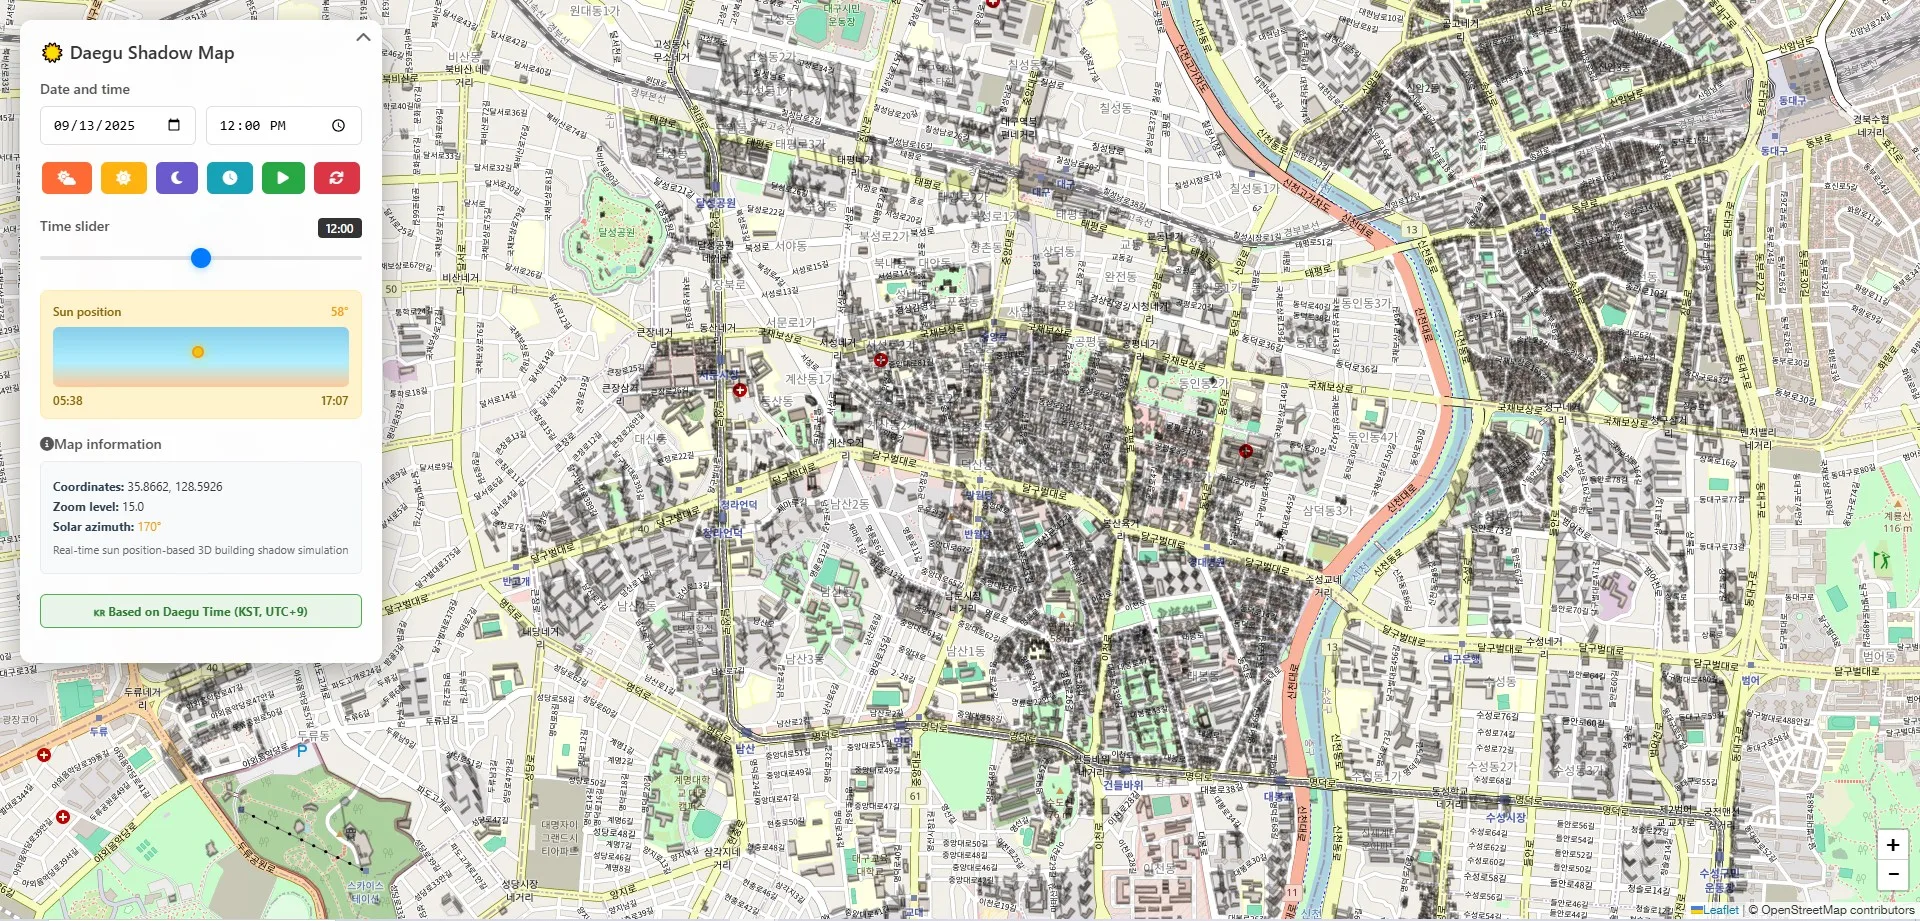
Urban Data
Daegu Open Data
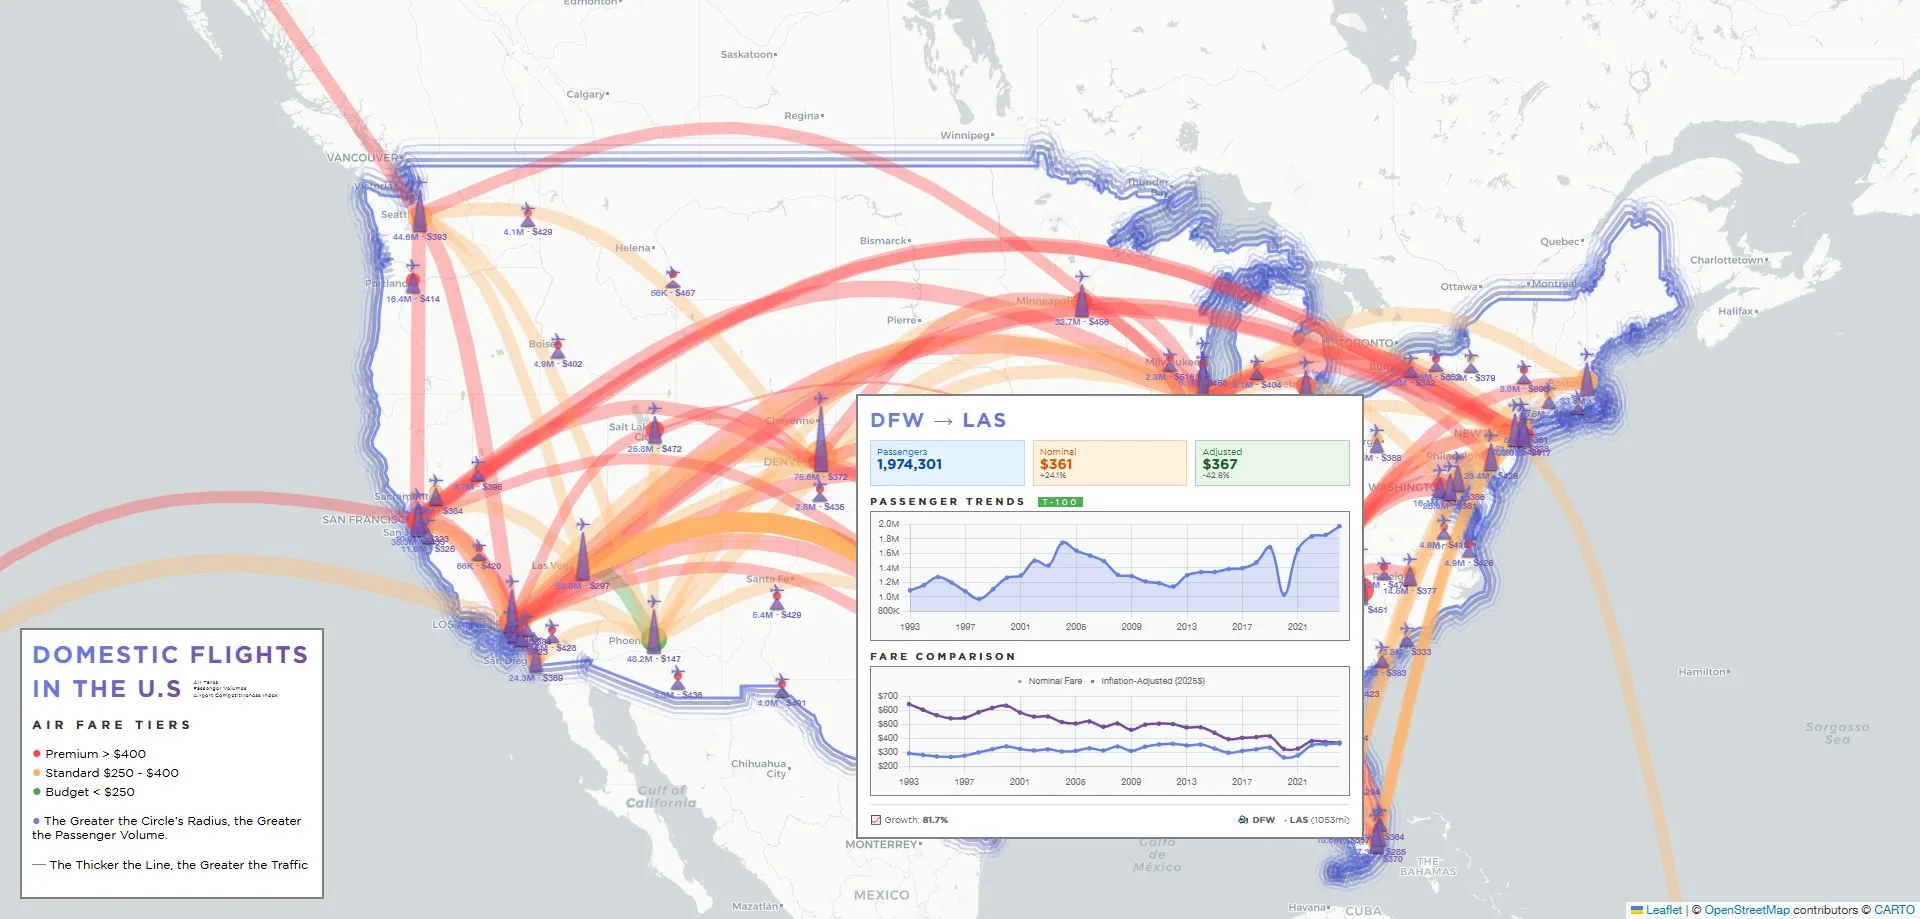
Dashboard
Domestic Airfare within the U.S
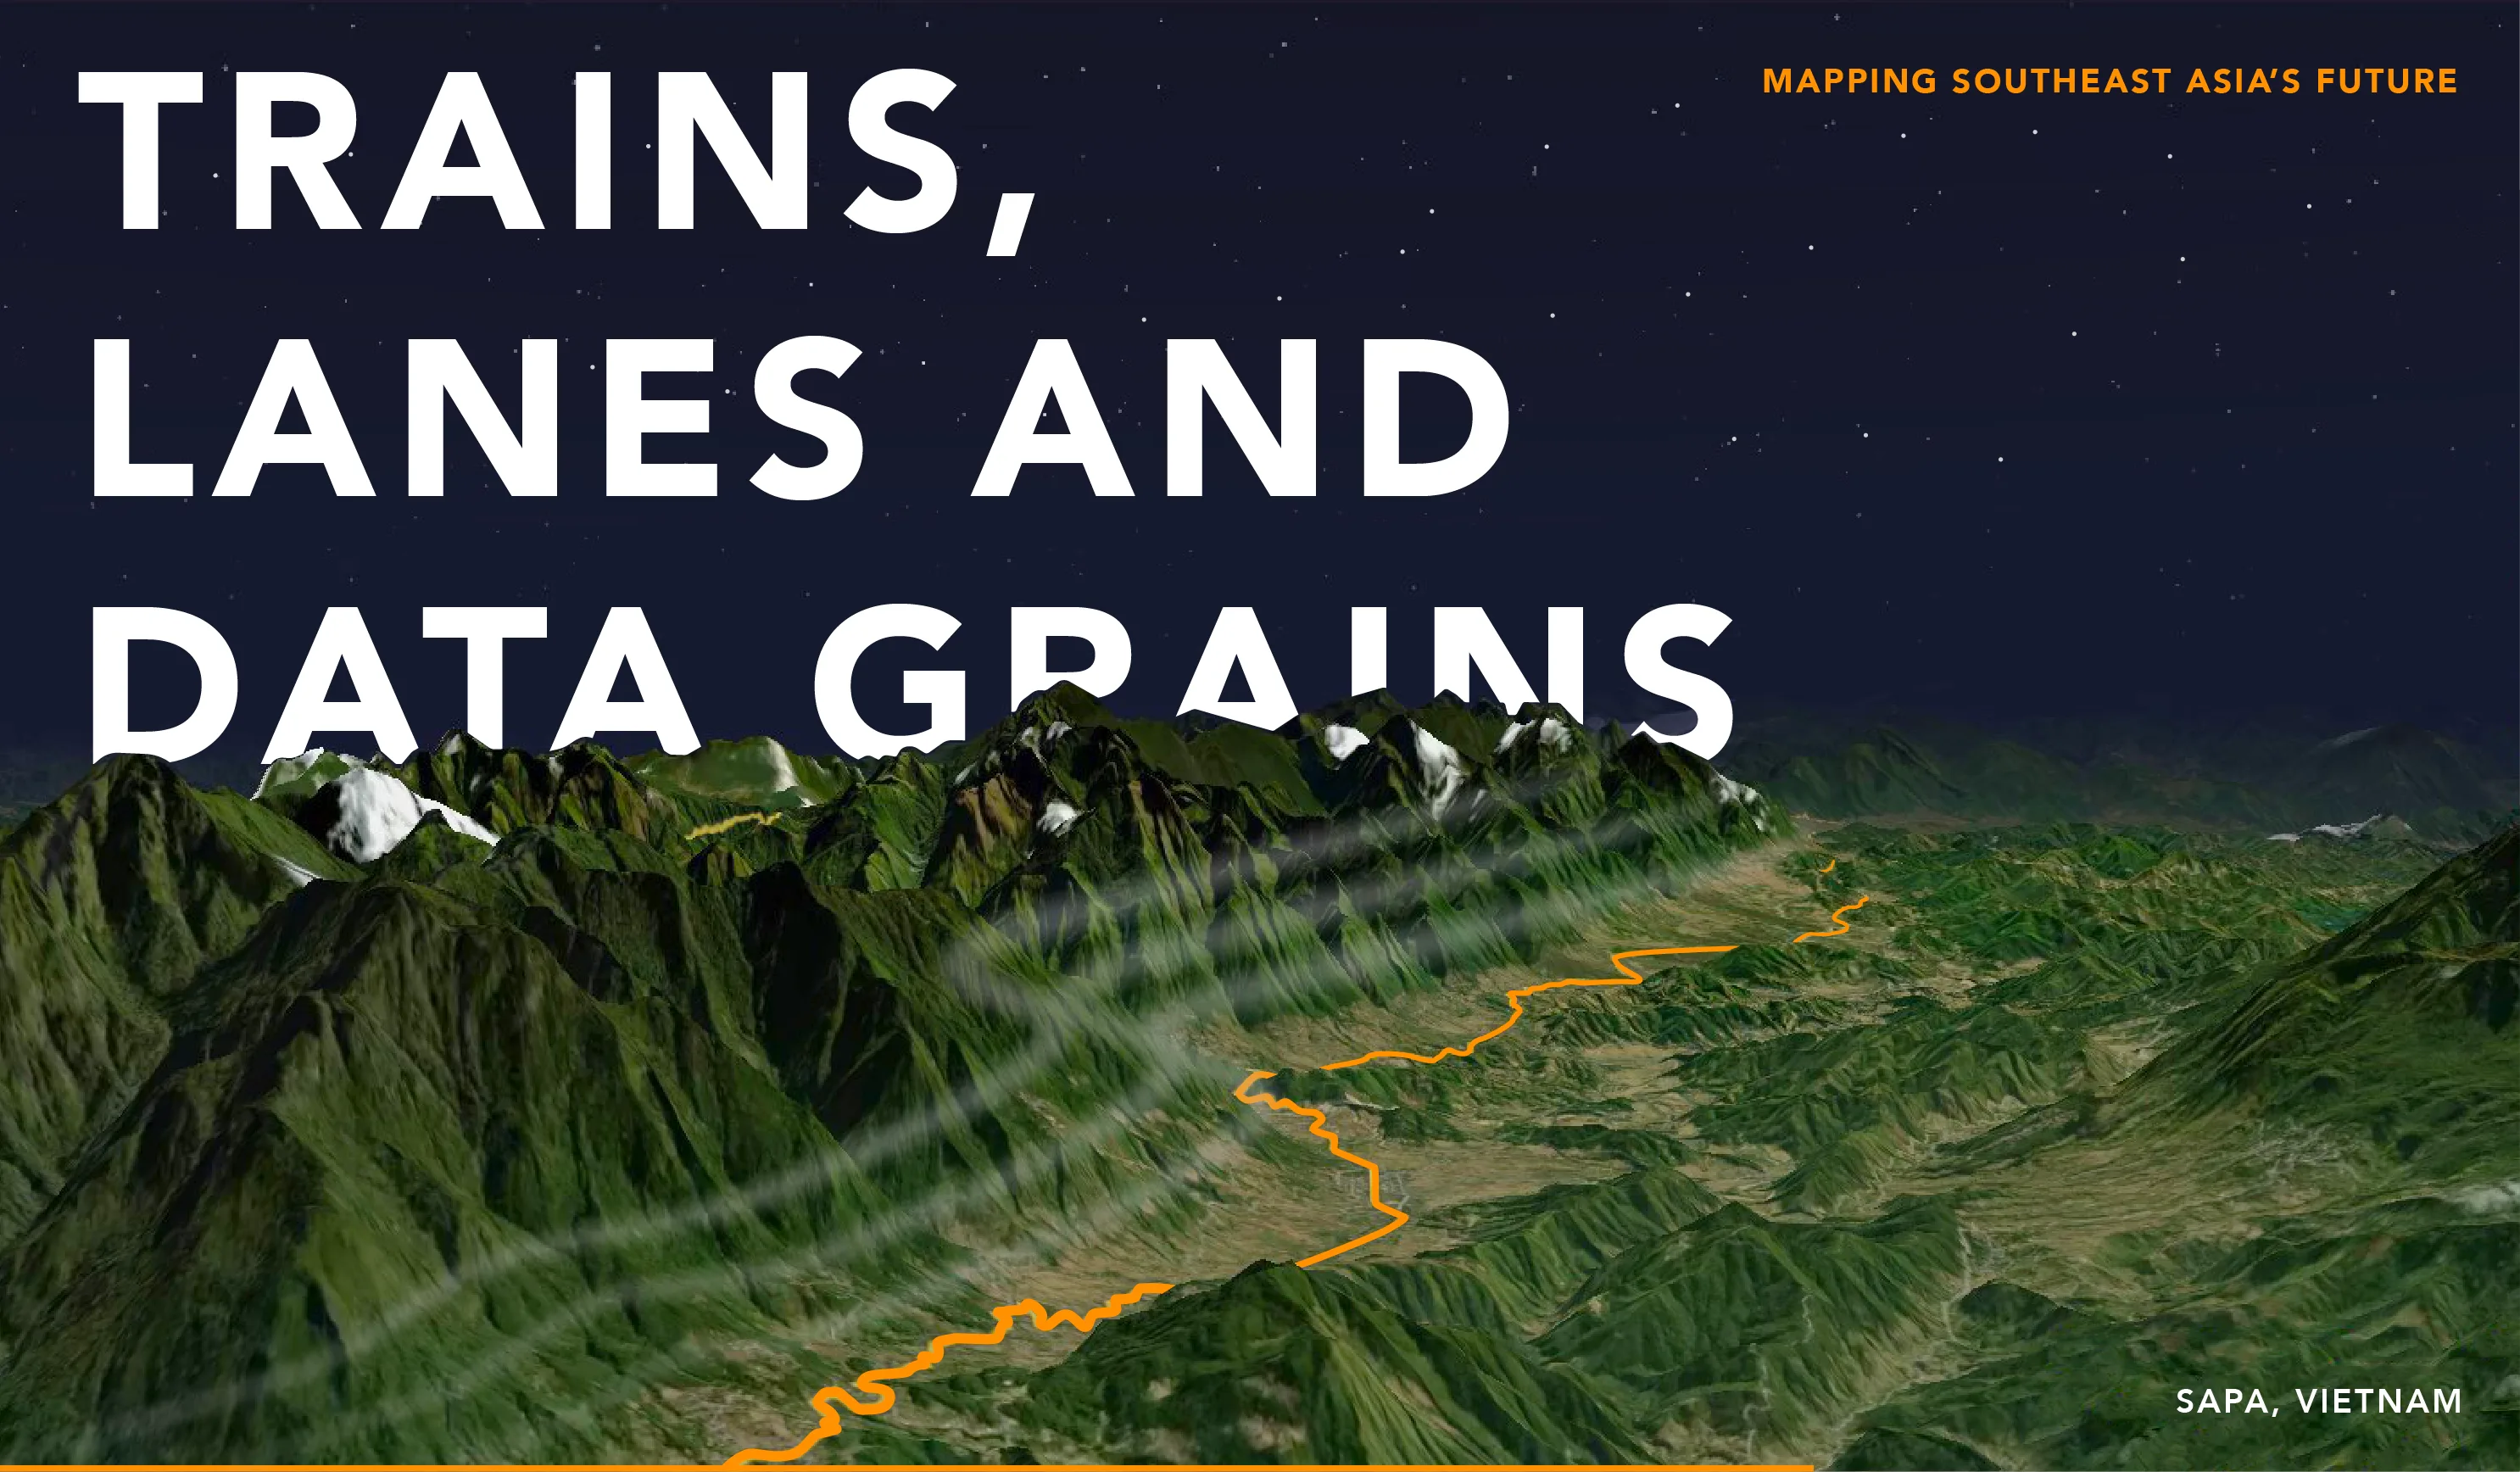
GIS / Speculative Urbanism
Trains, Lanes, and Data Grains
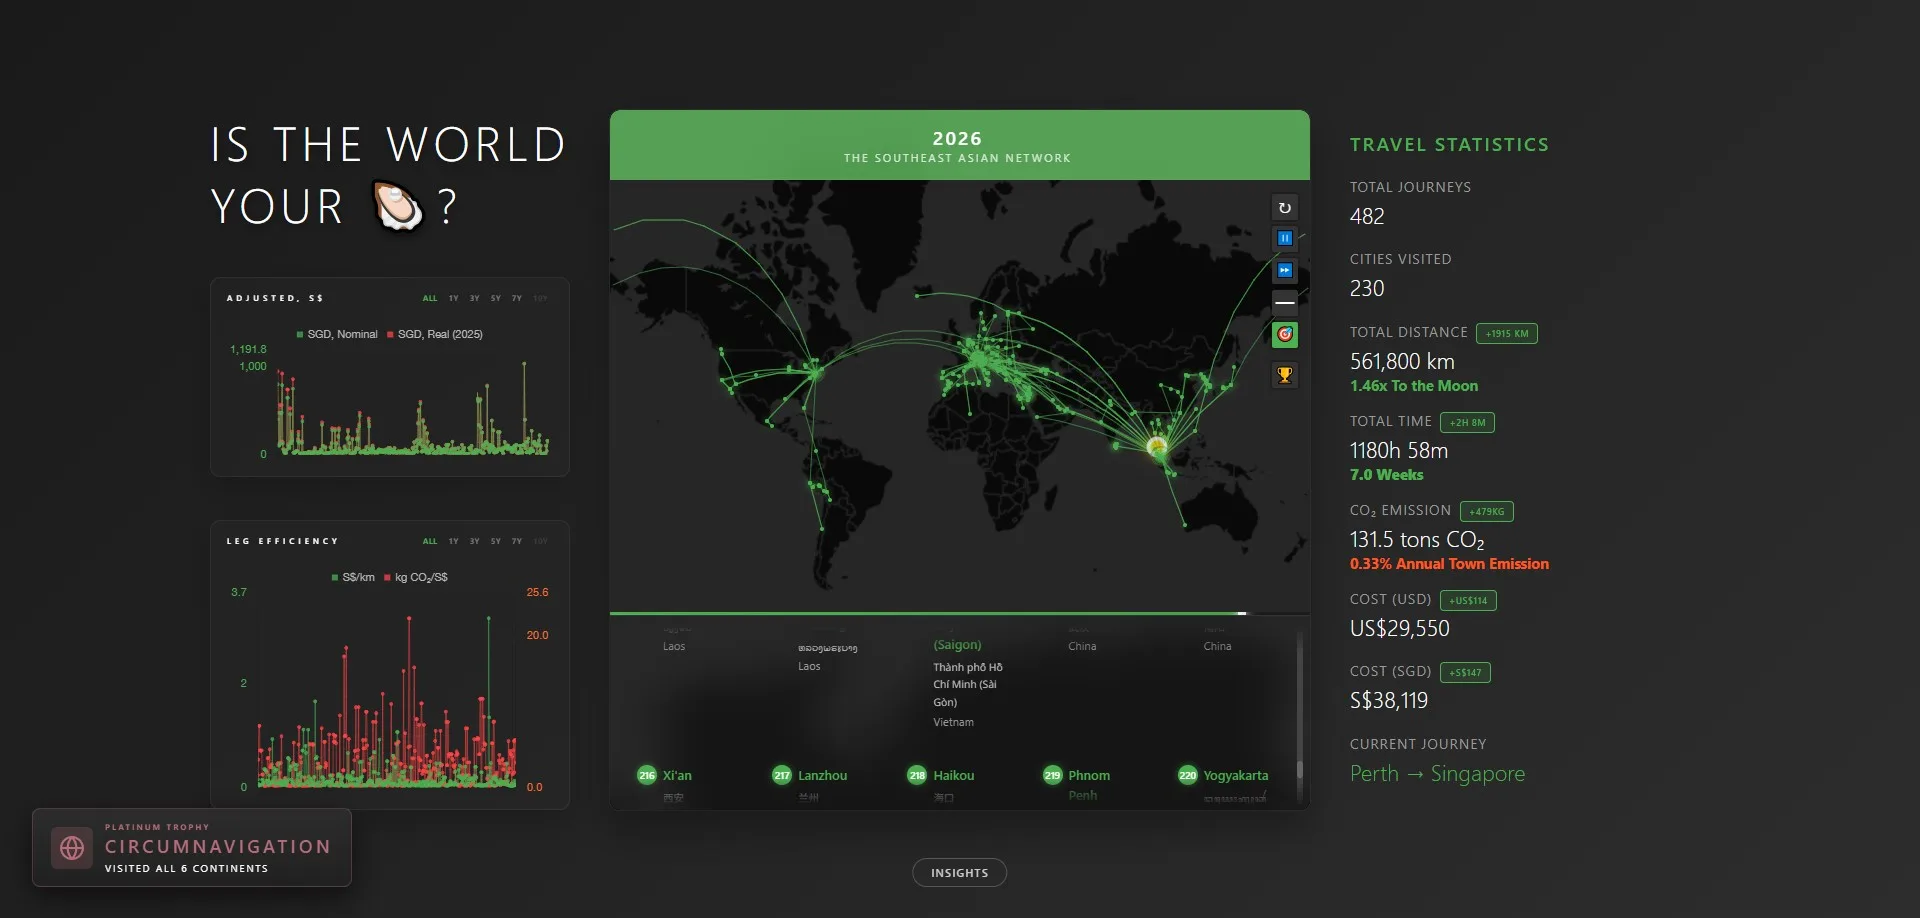
Travel History
Is the World Your Oyster?
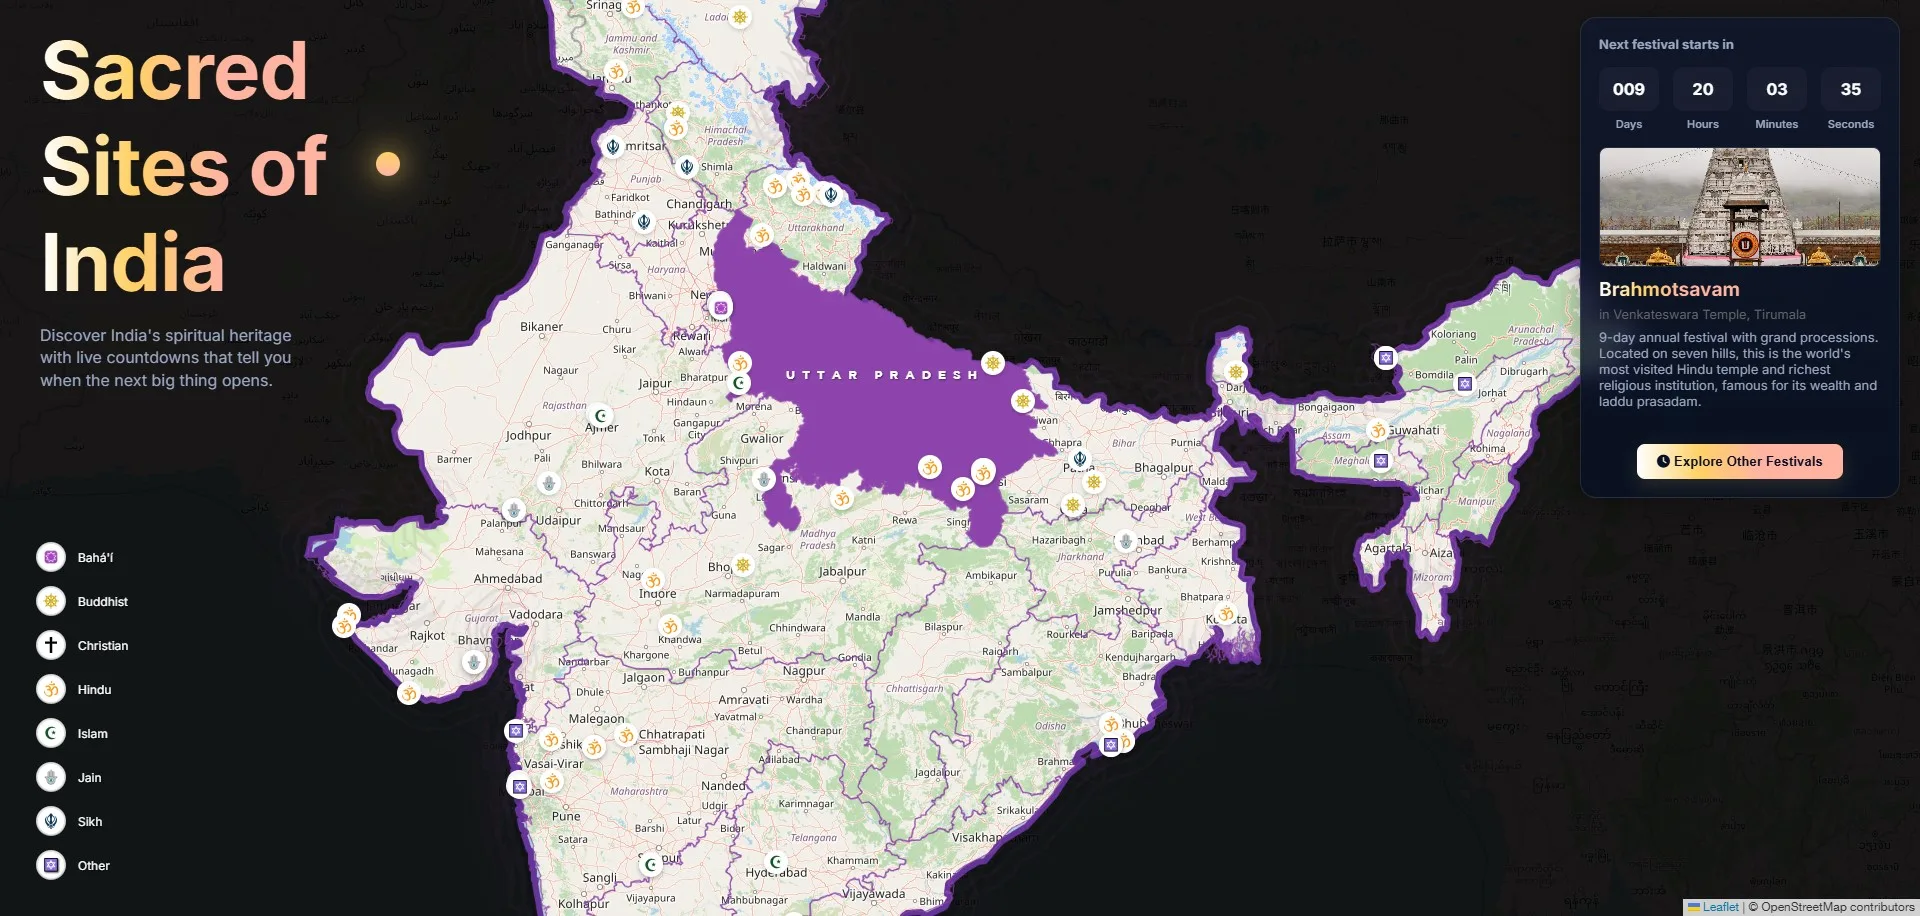
Interactive Map
Sacred Sites of India
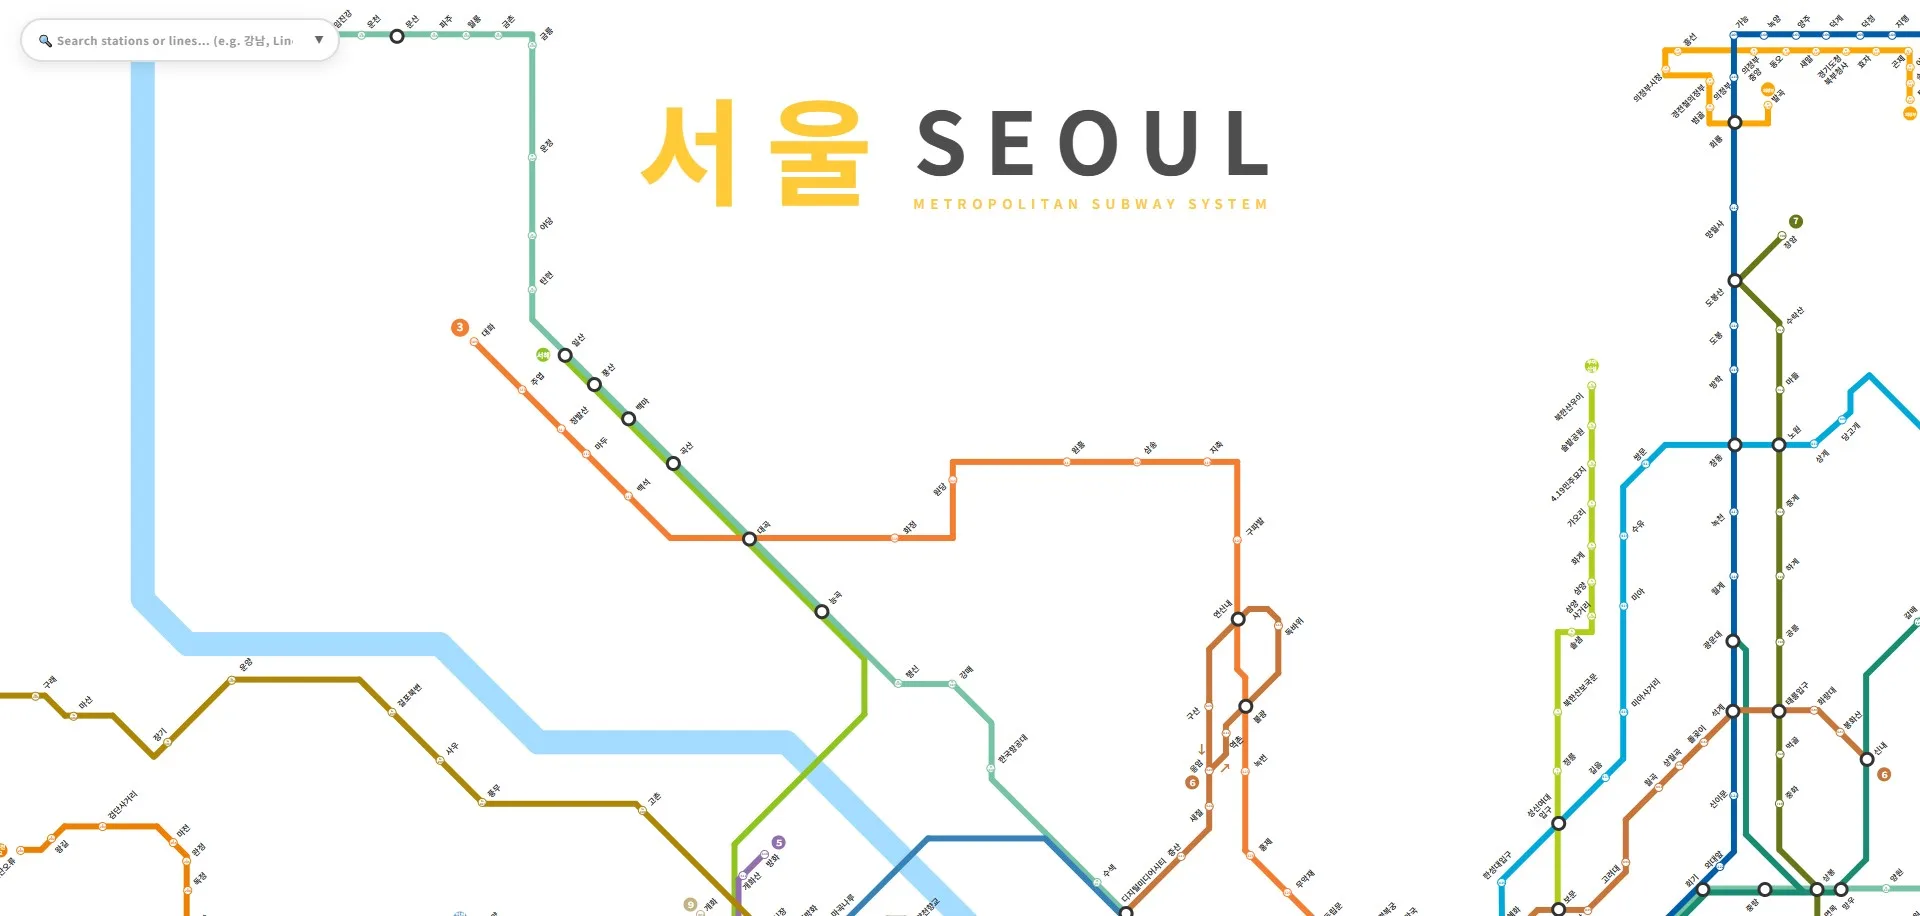
Live Transit Map
Seoul's Metropolitan System
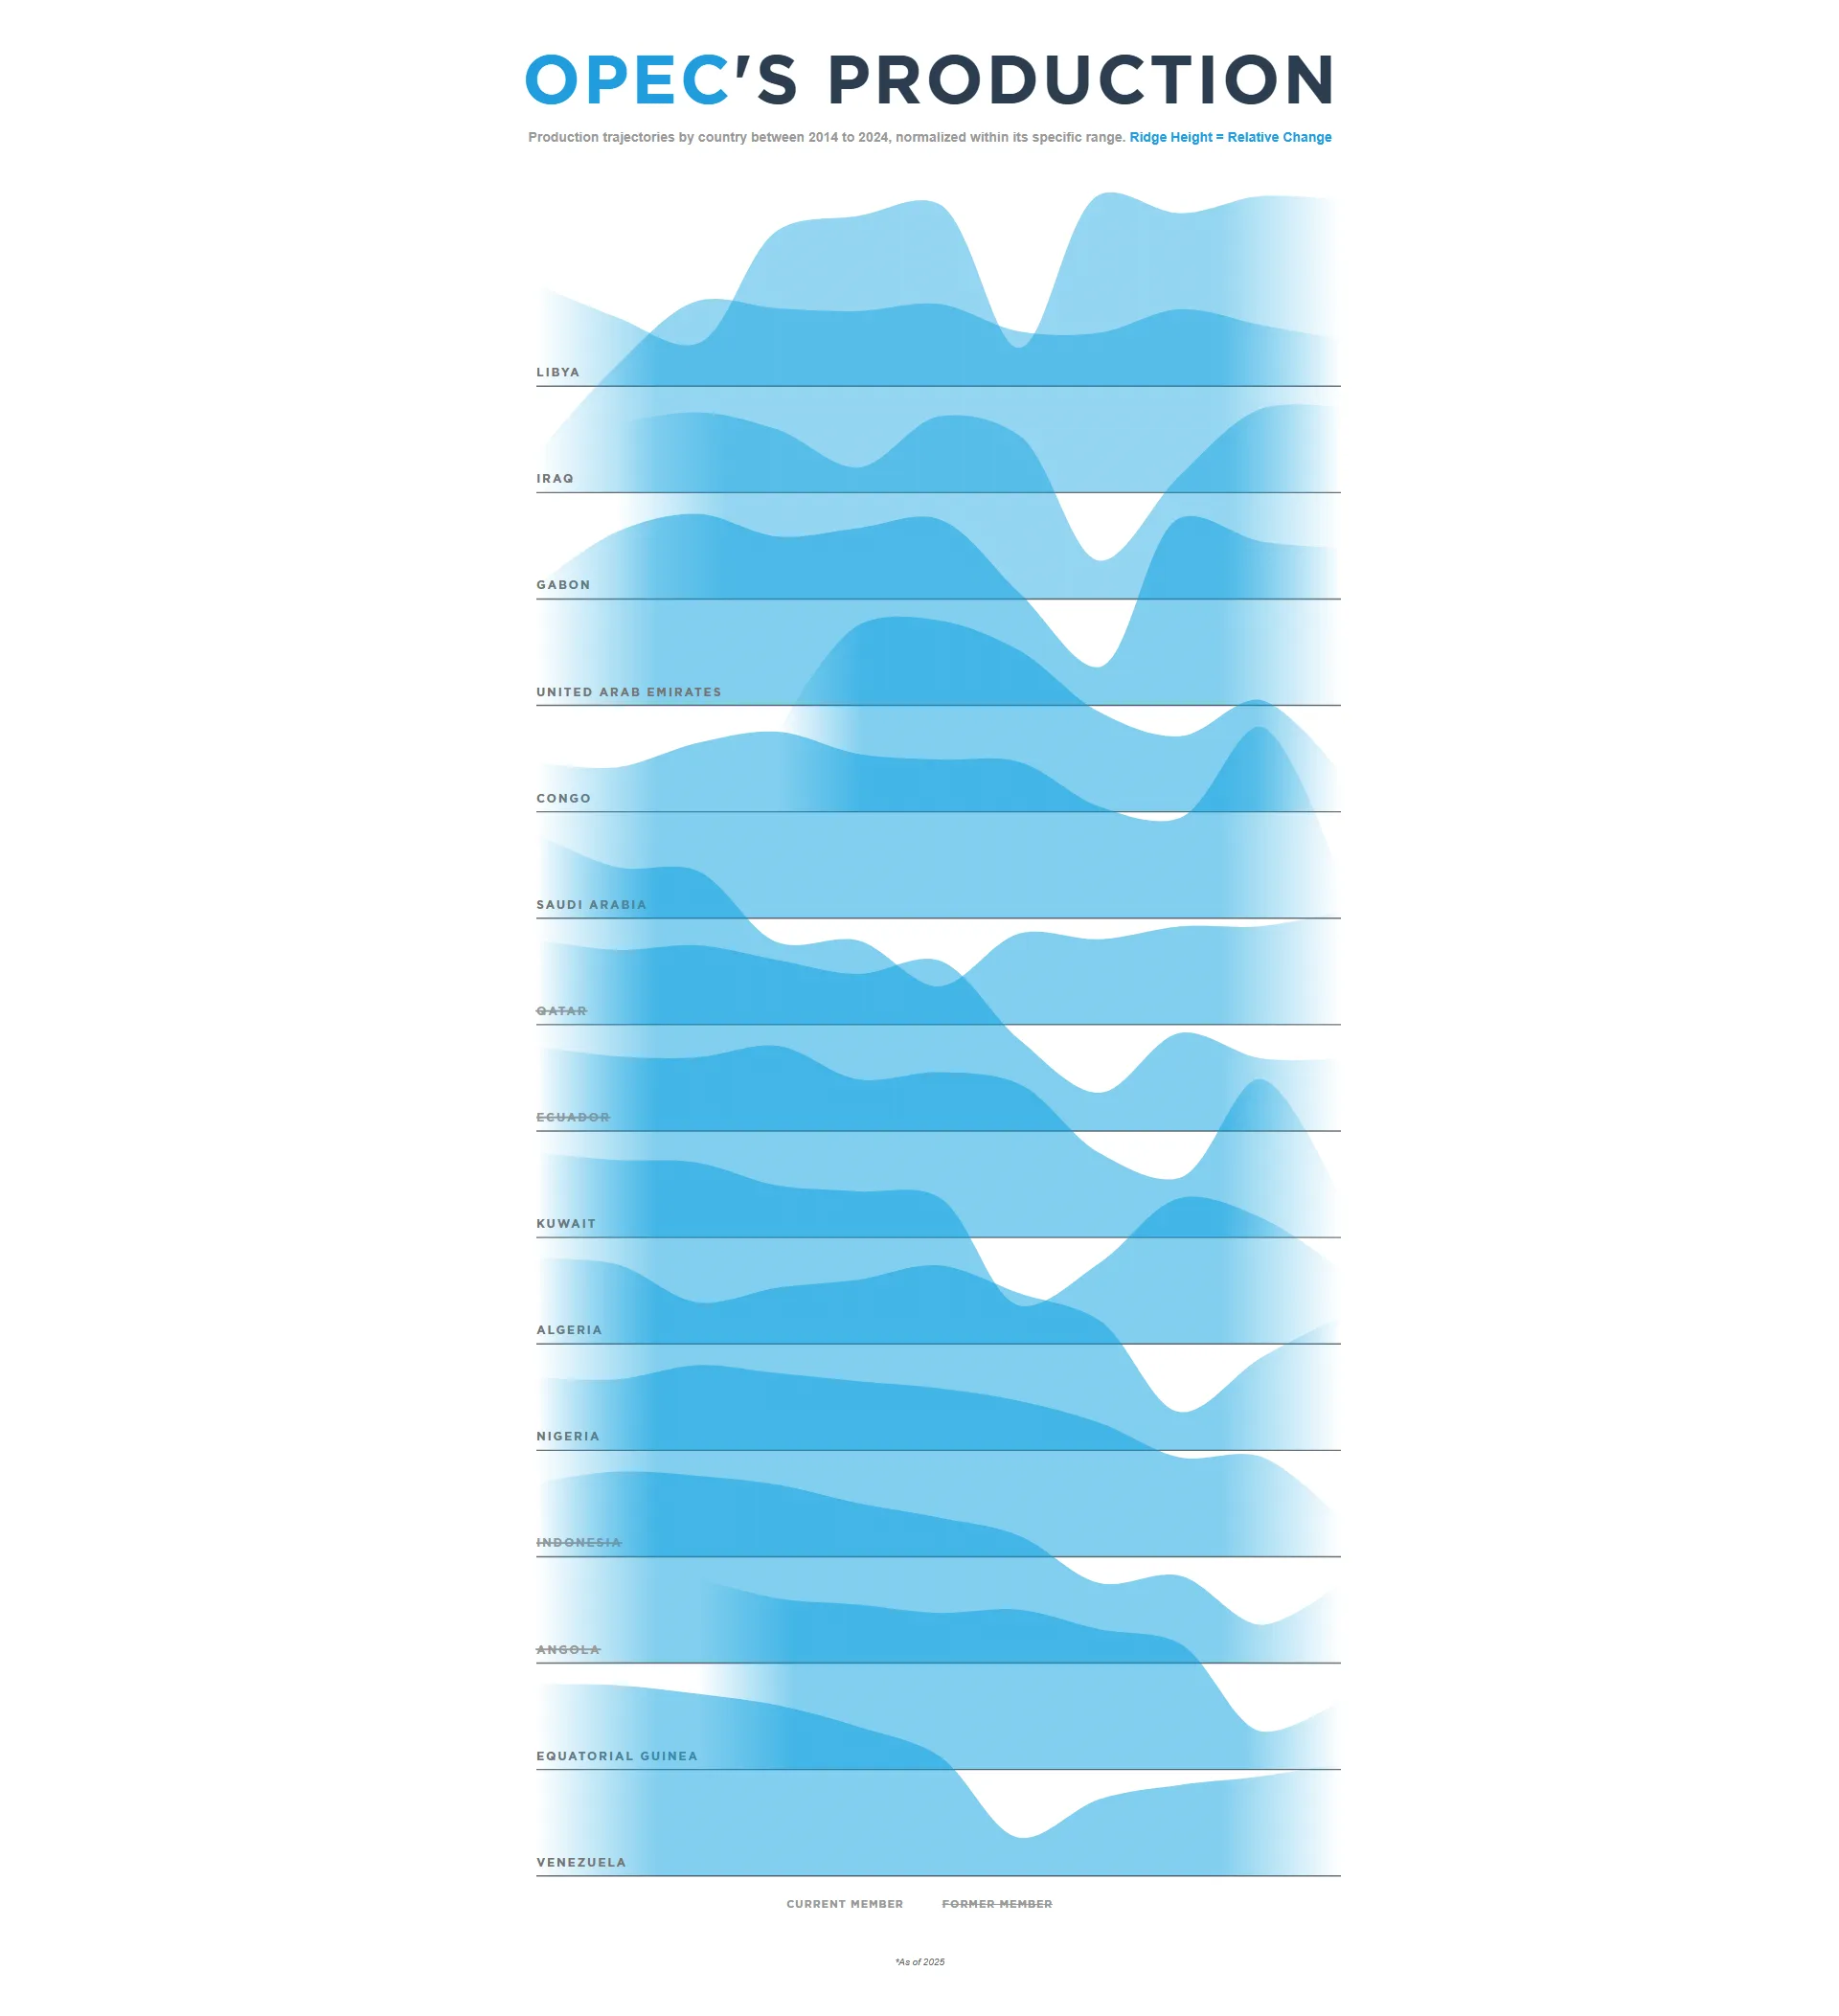
Ridgeline Plot
OPEC's Production
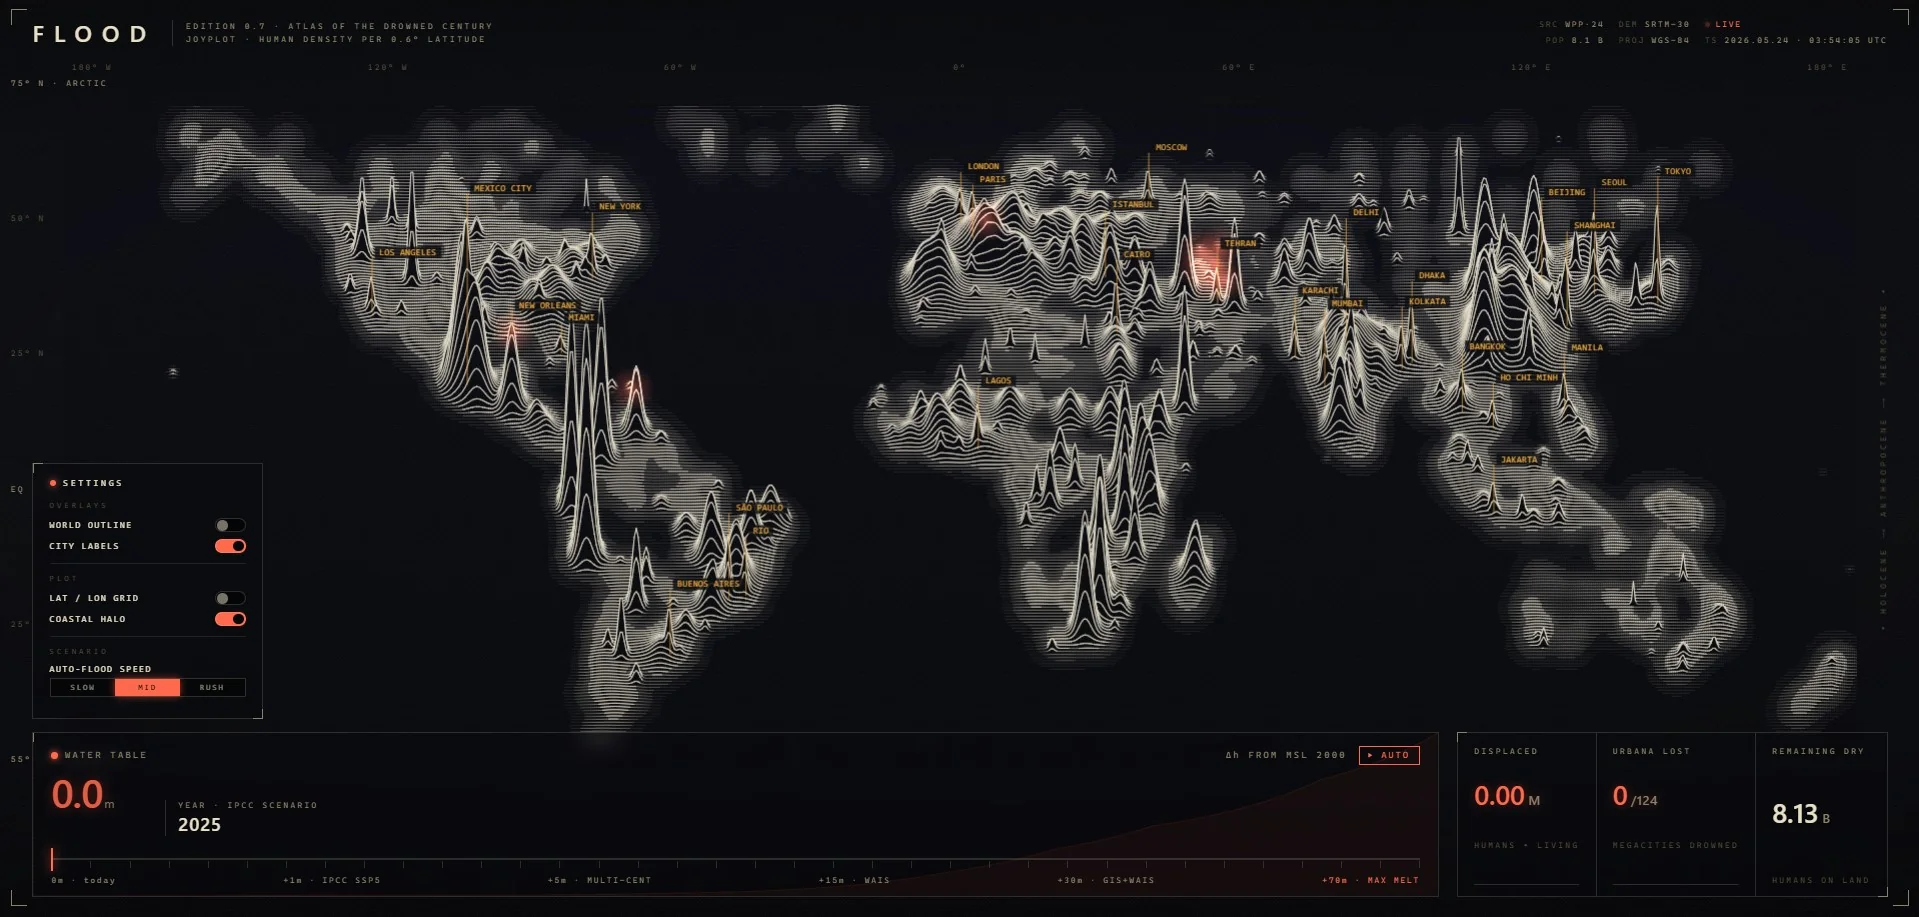
Joyplot
Flood: Atlas of the Drowned Century
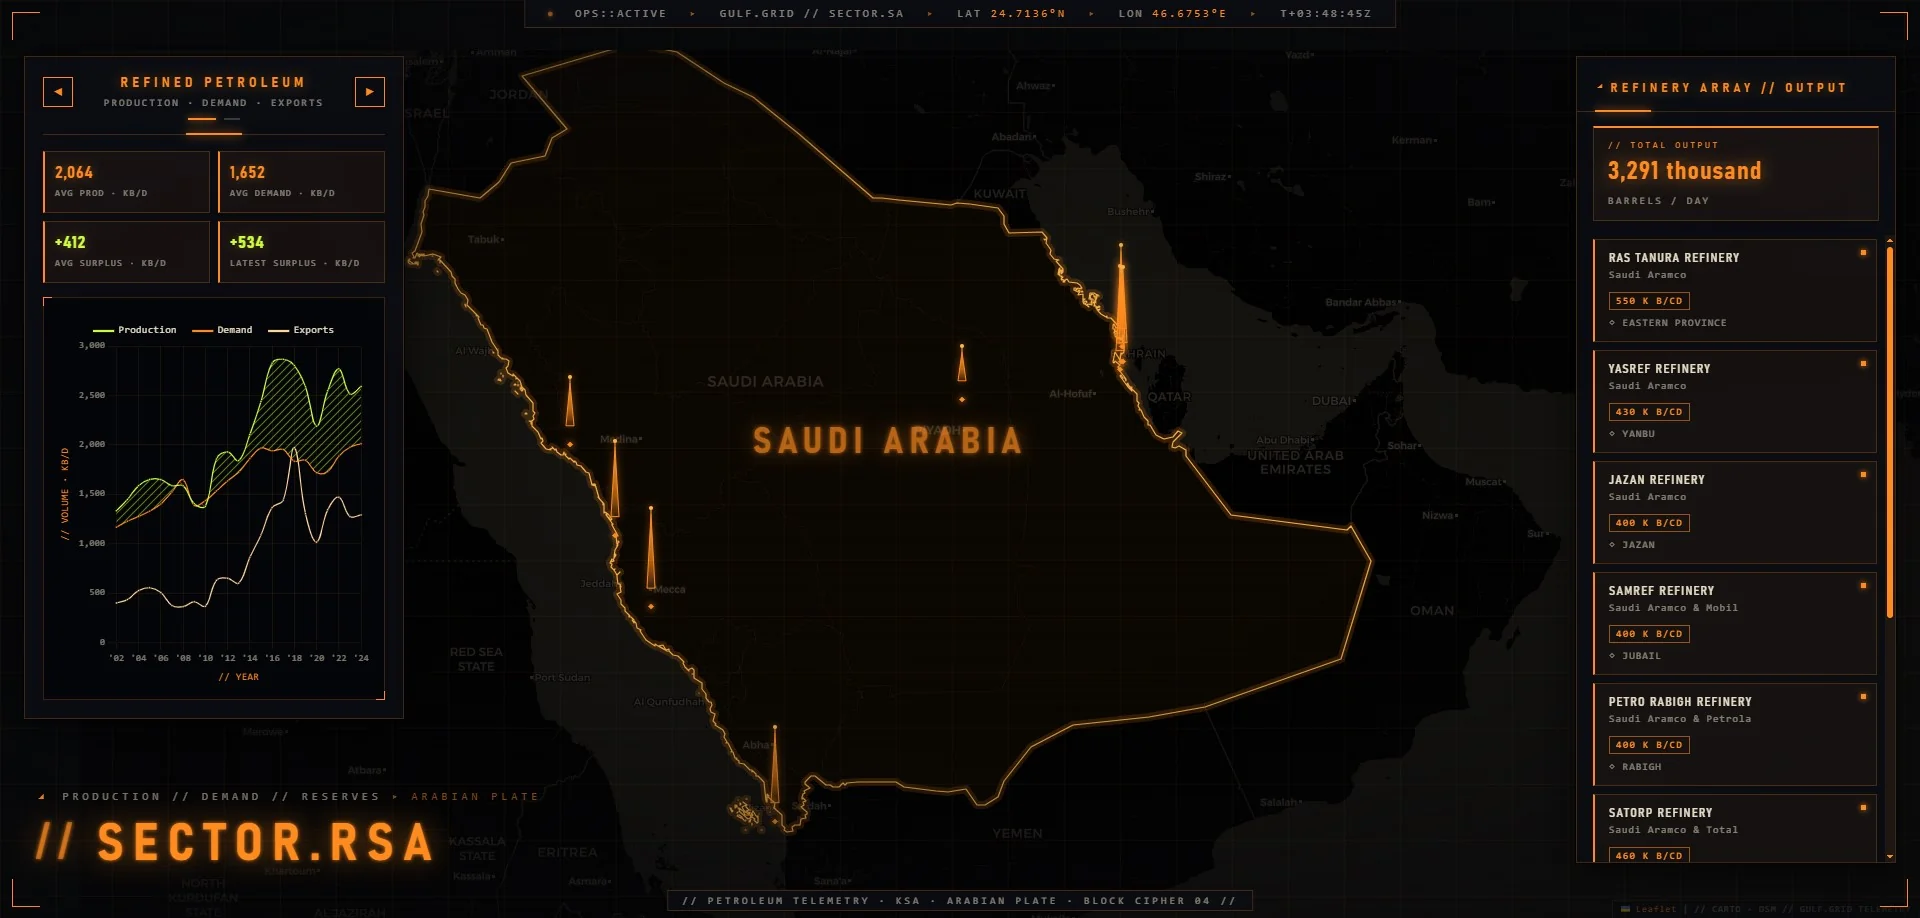
Dashboard
Saudi Arabia's Energy
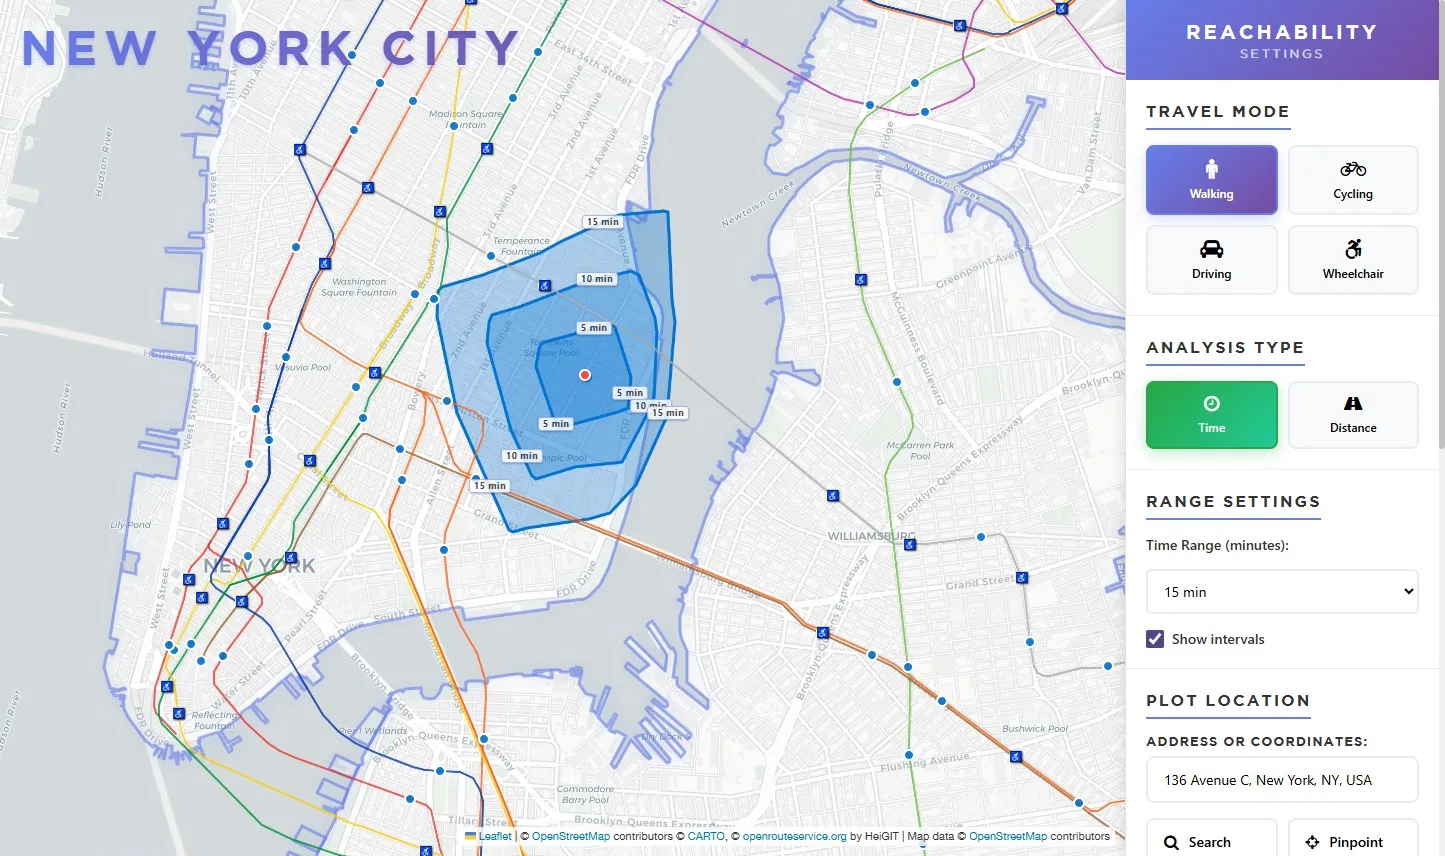
Isochrone Map / GTFS
Reachability in NYC
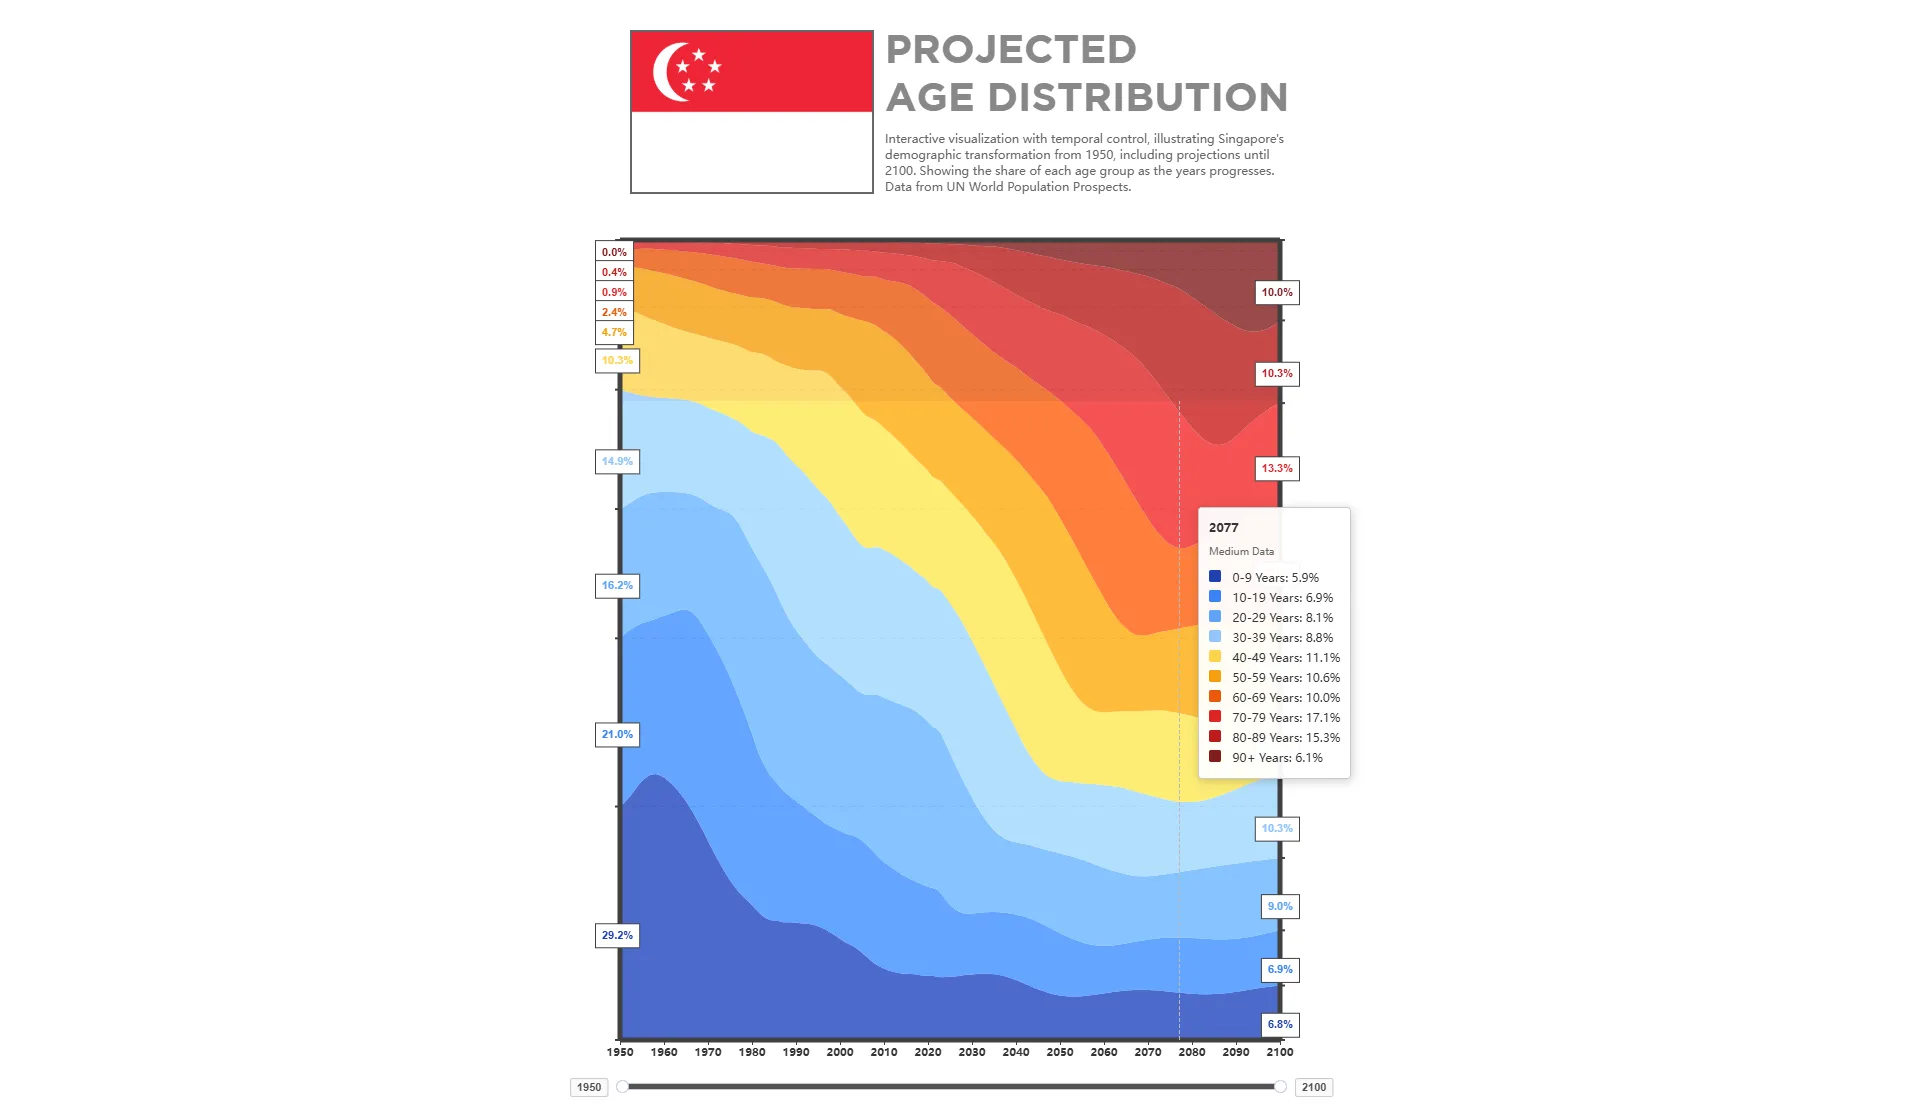
Population Pyramid
Singapore's Projected Age Distribution
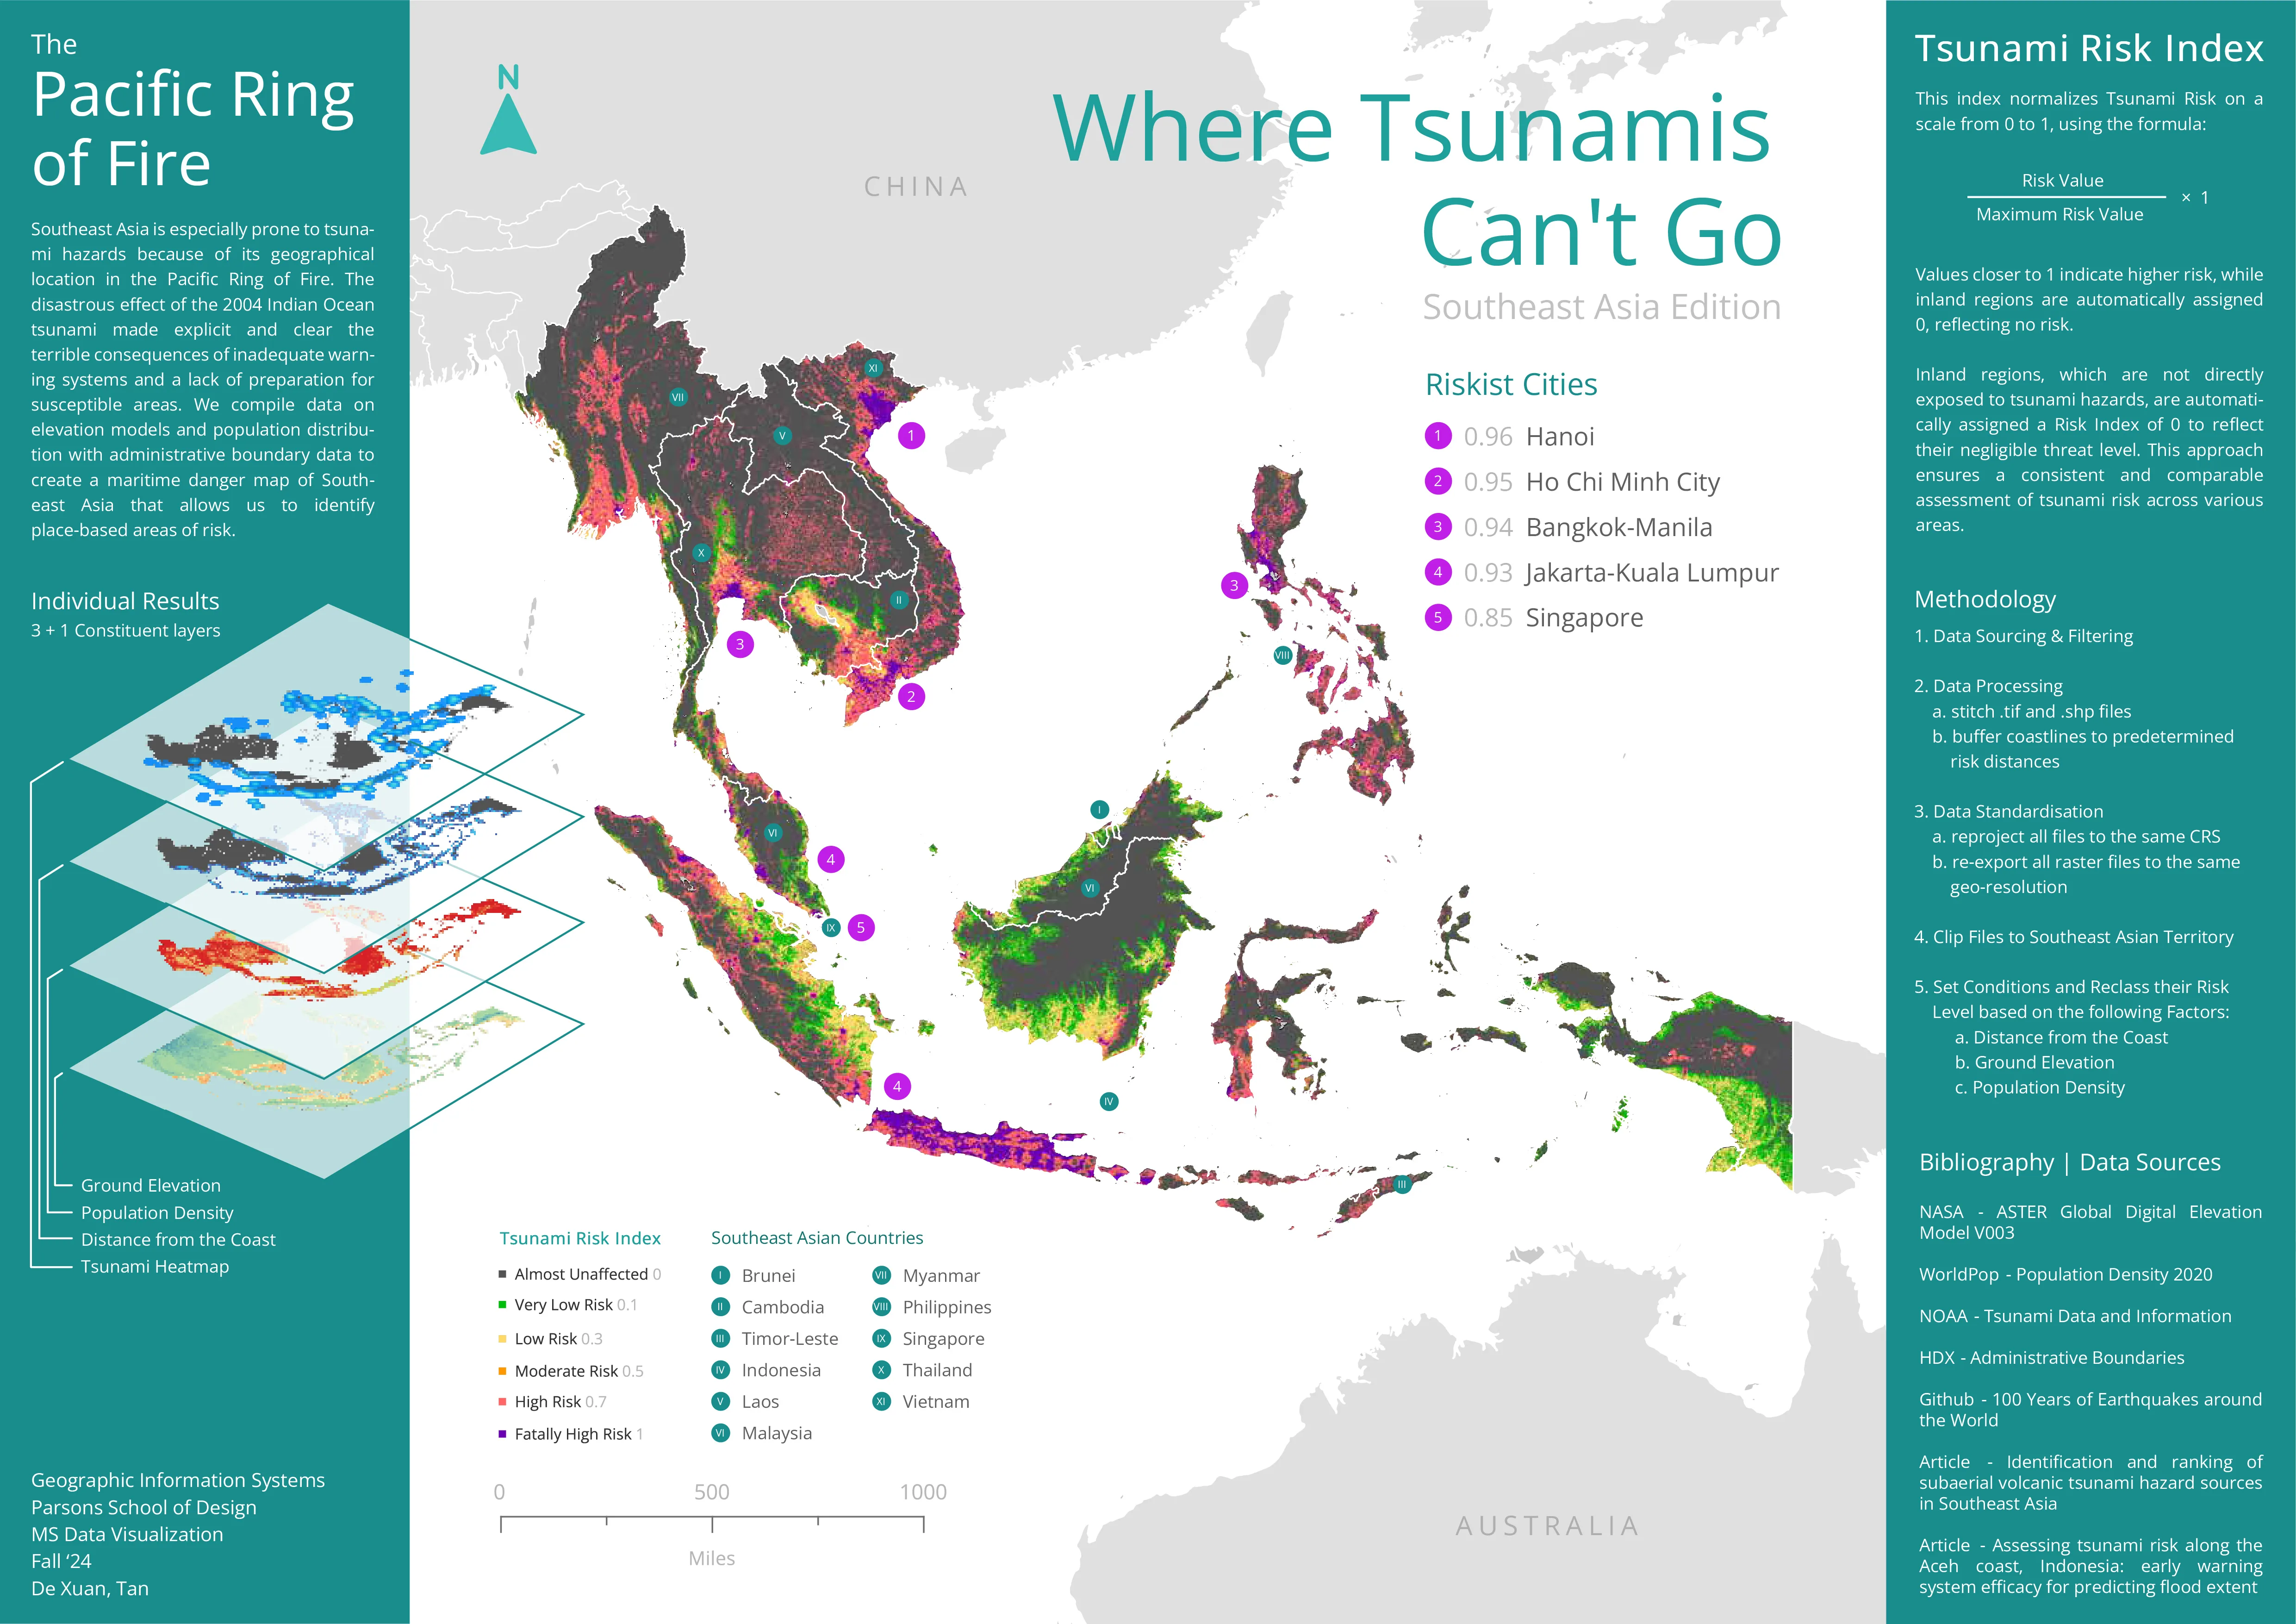
GIS Elevation Map / SRTM Data
Where Tsunamis Can't Go
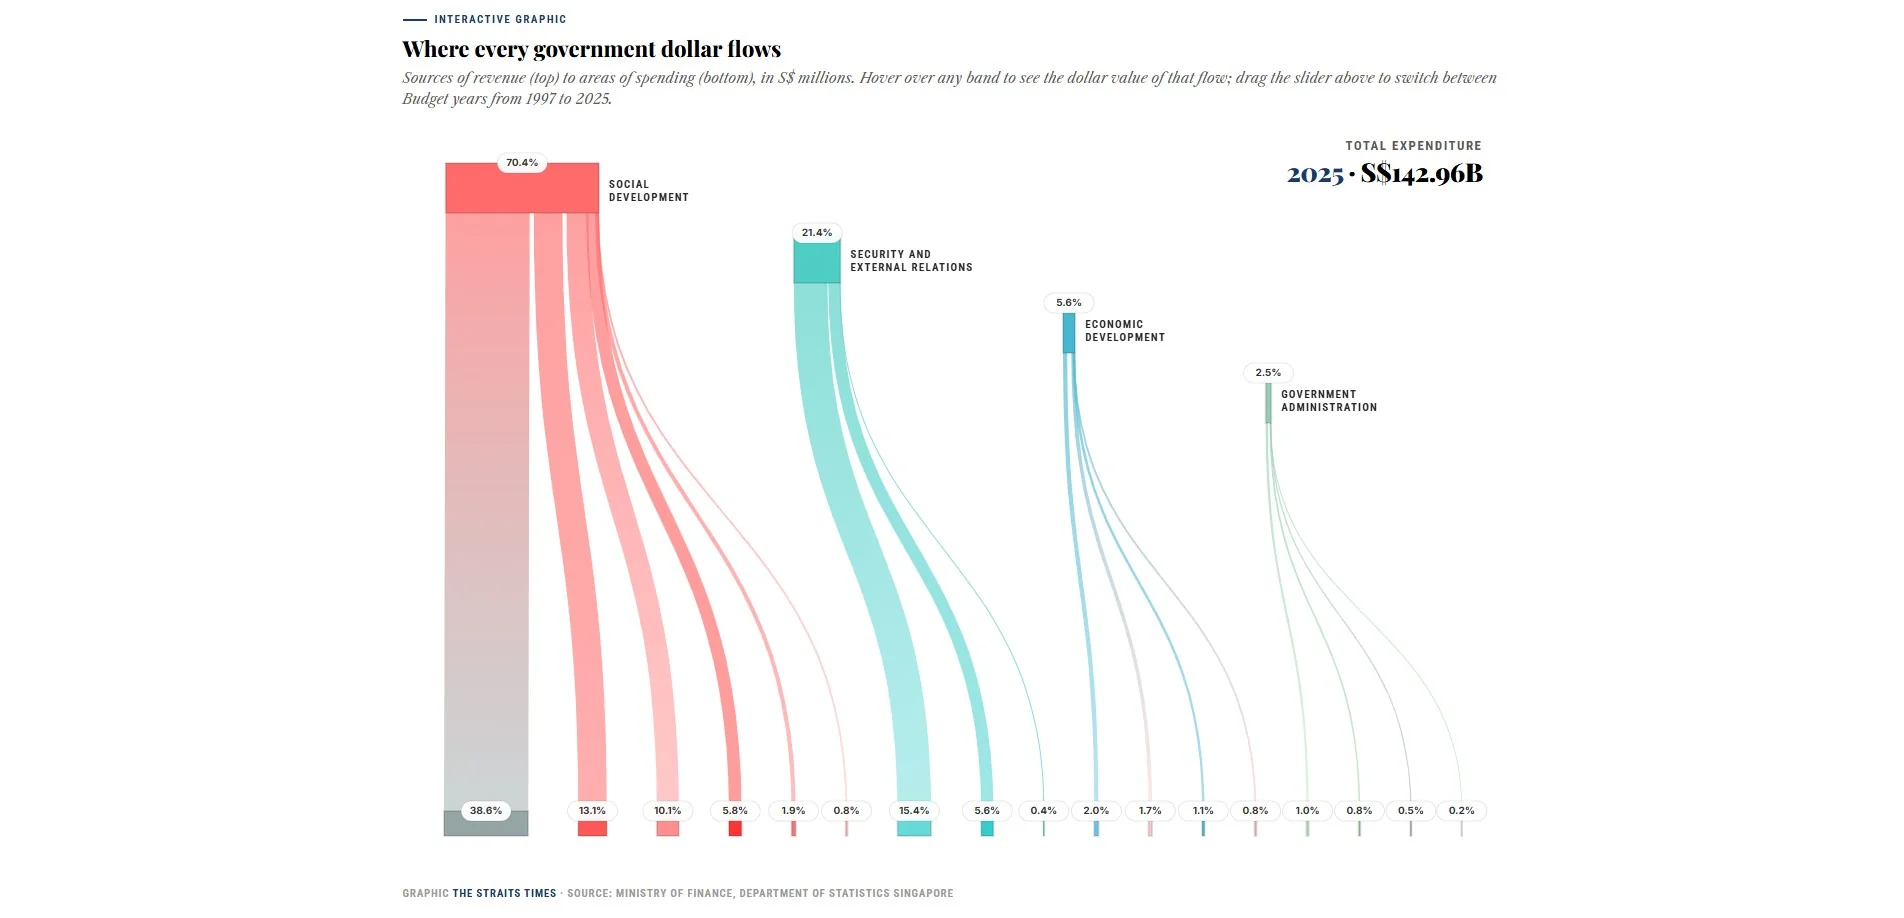
Sankey Diagram
Singapore Government's Expenditure
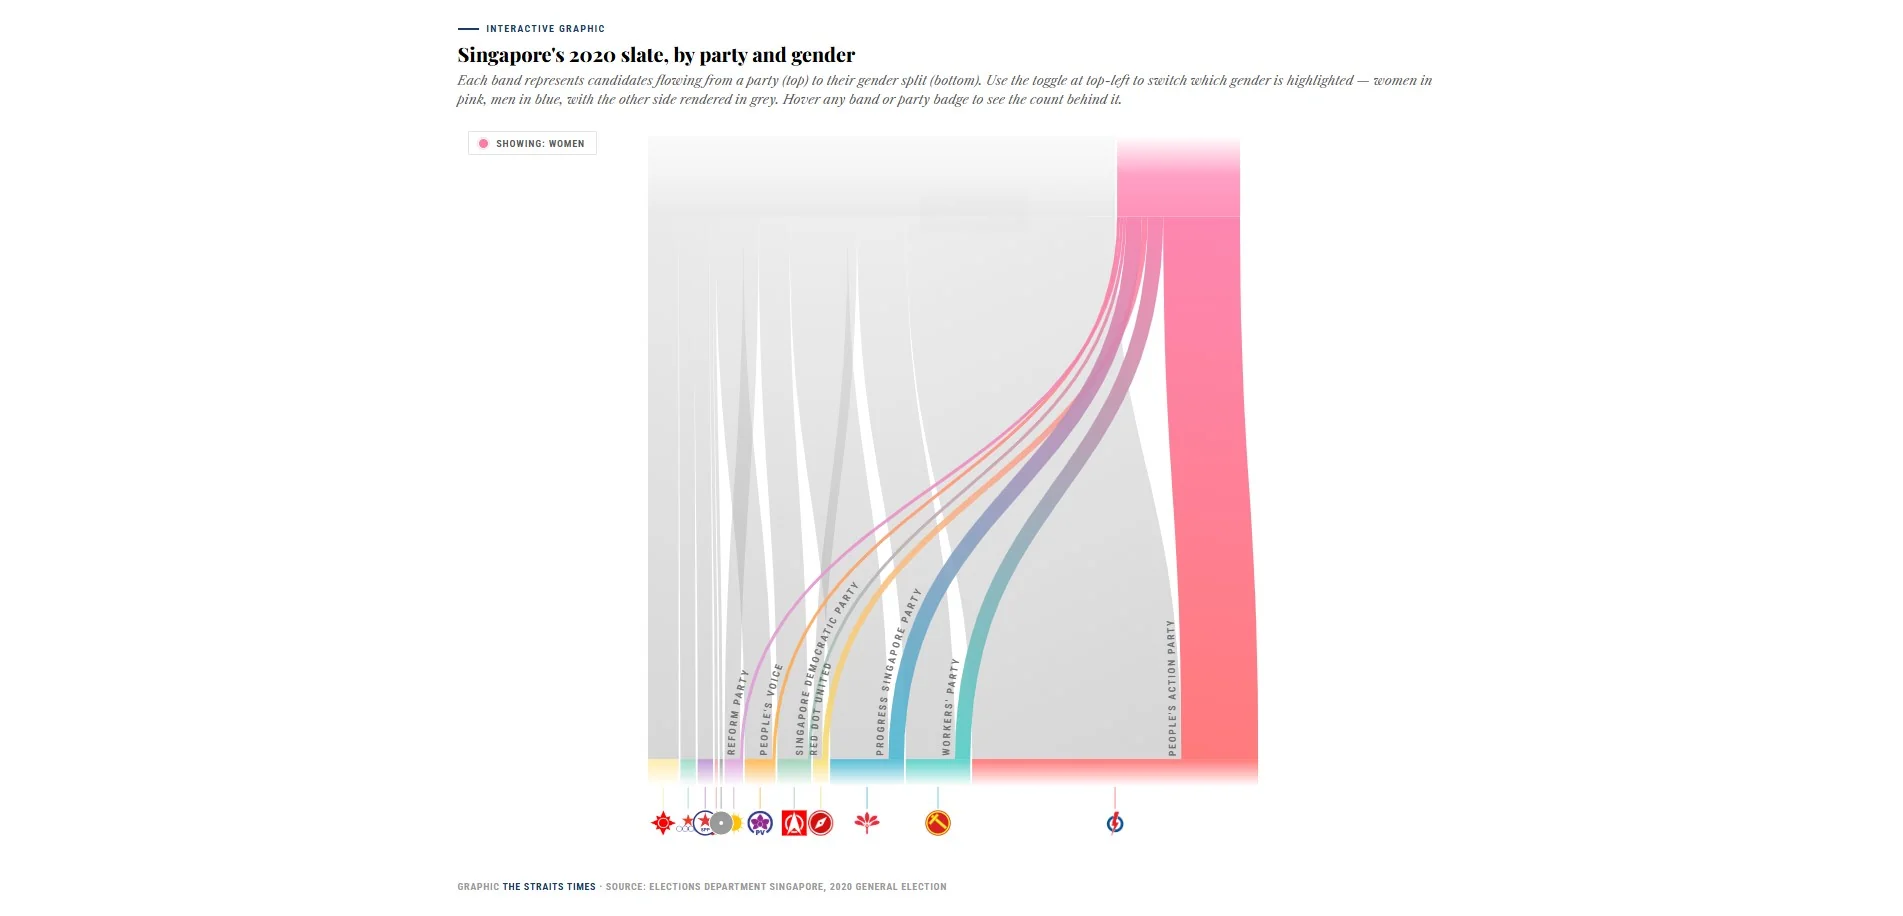
Sankey Diagram
Singapore's 2020 Election Slate
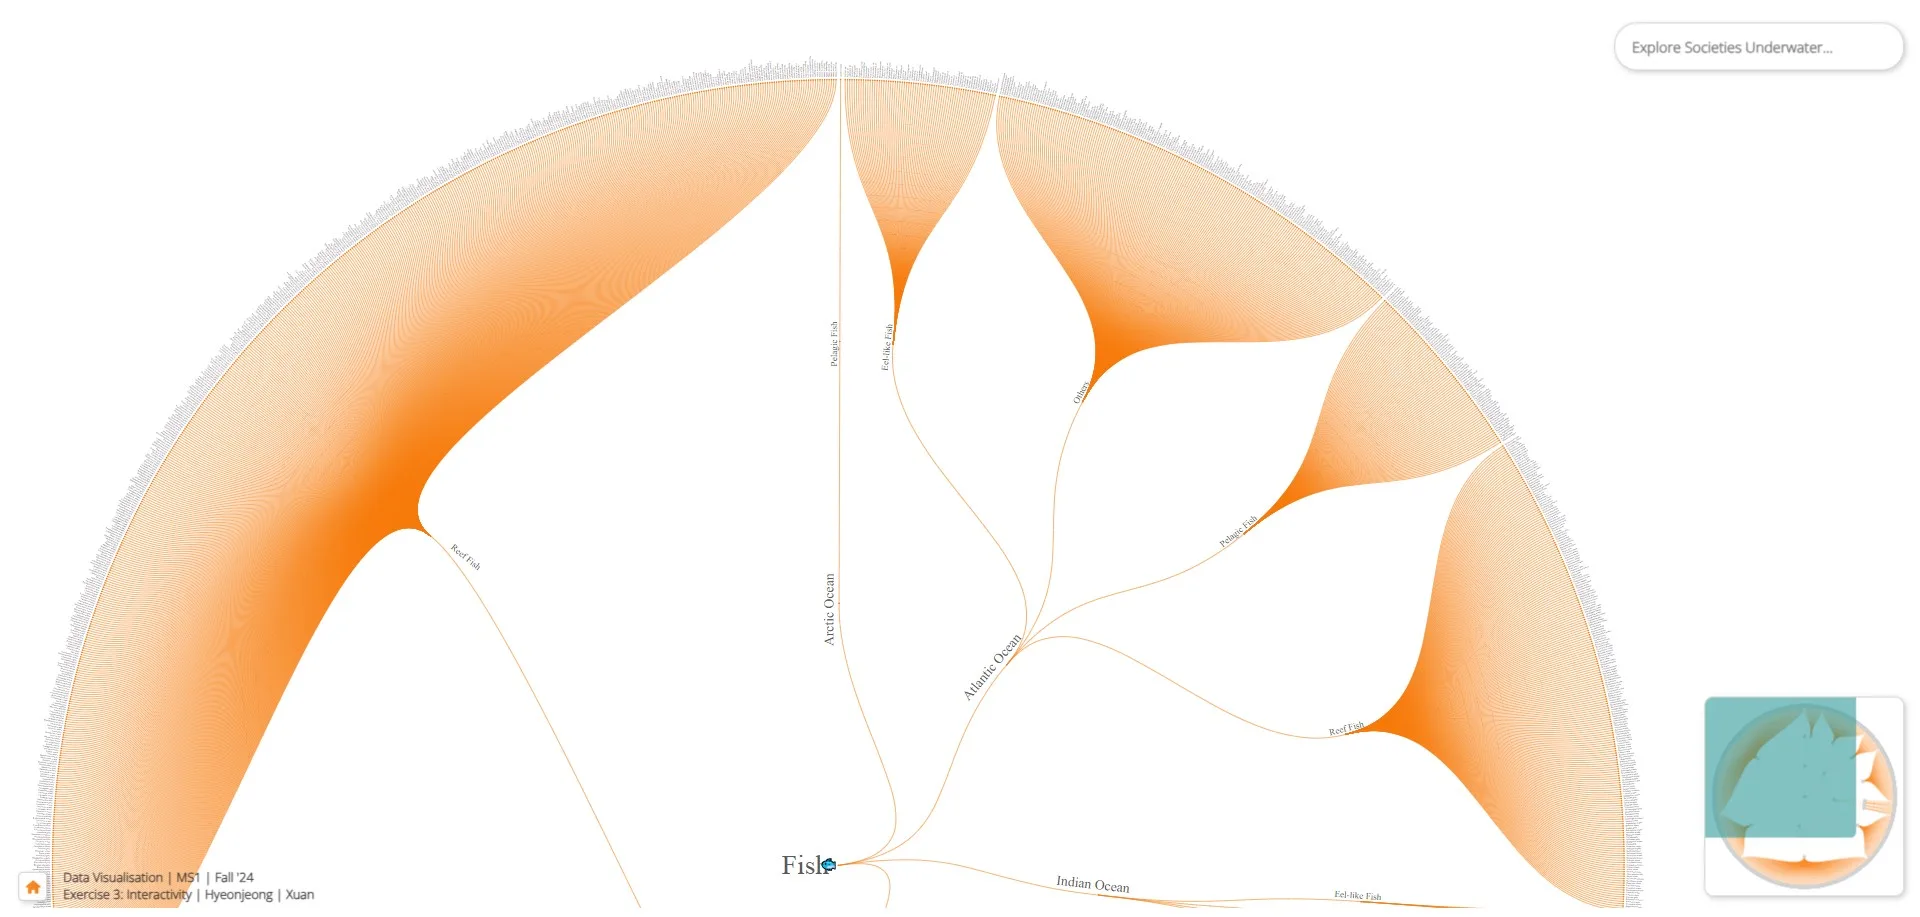
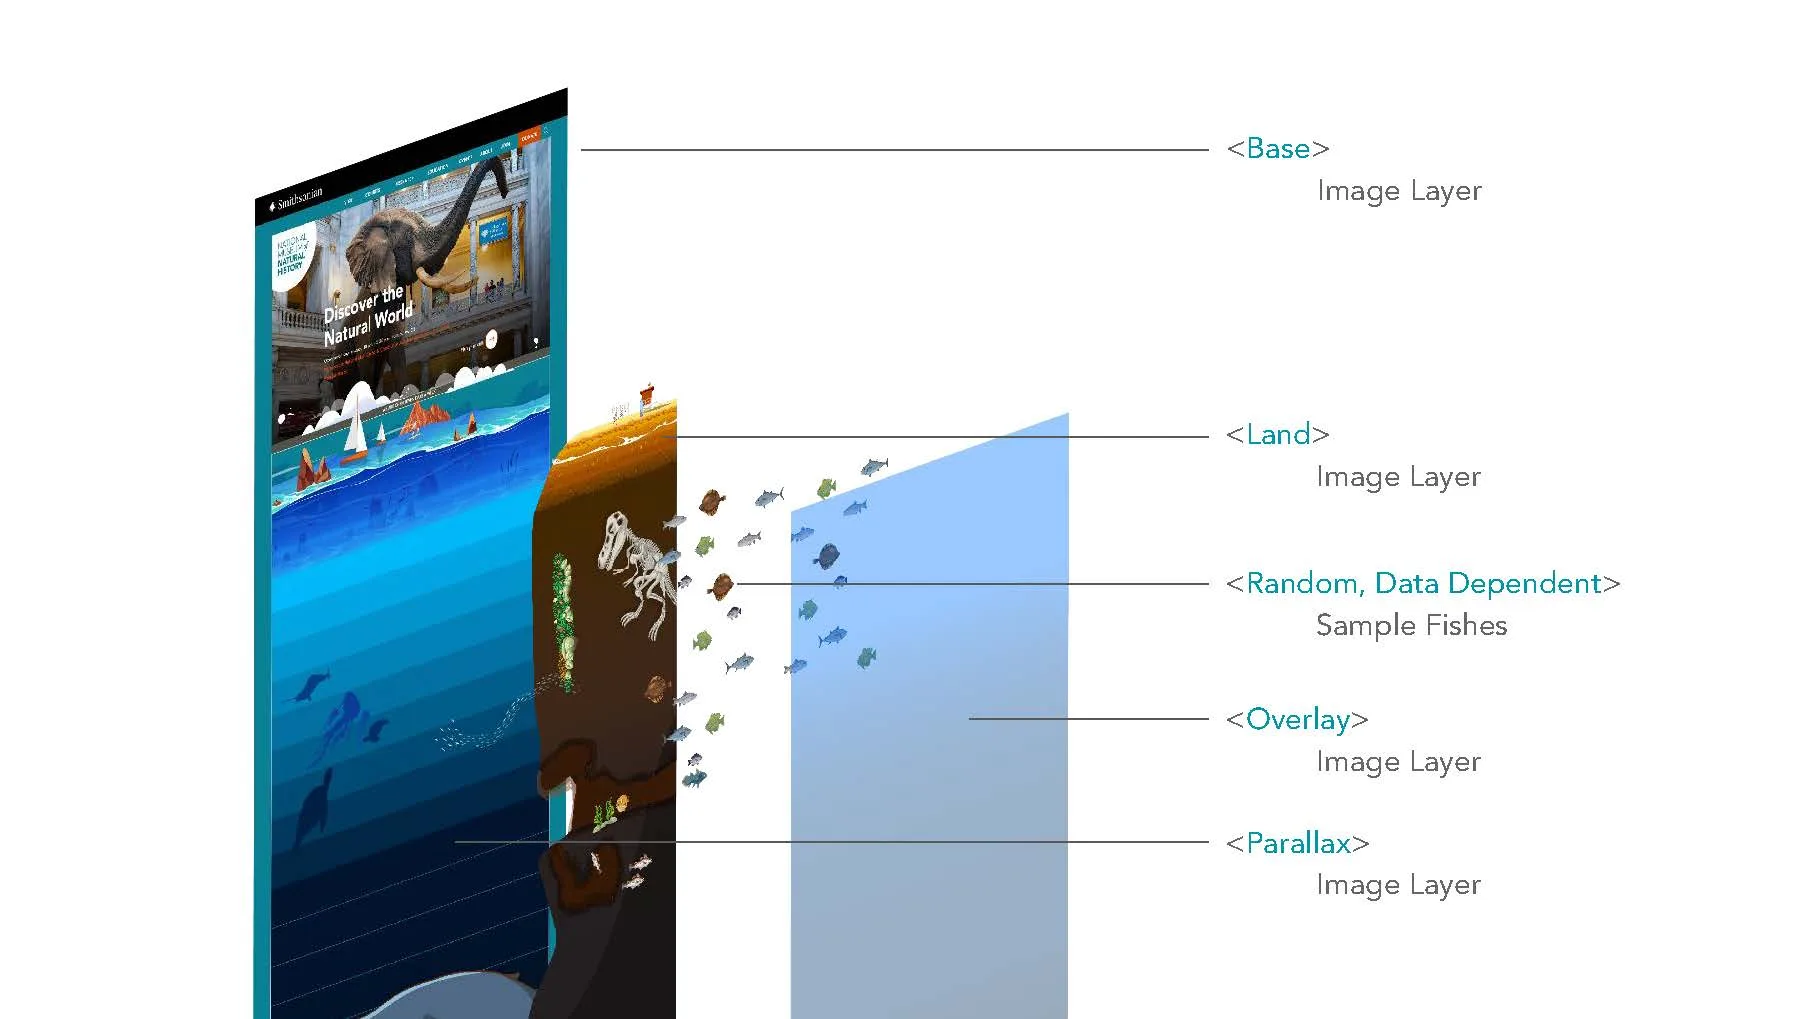
Smithsonian
Deep Sea Society
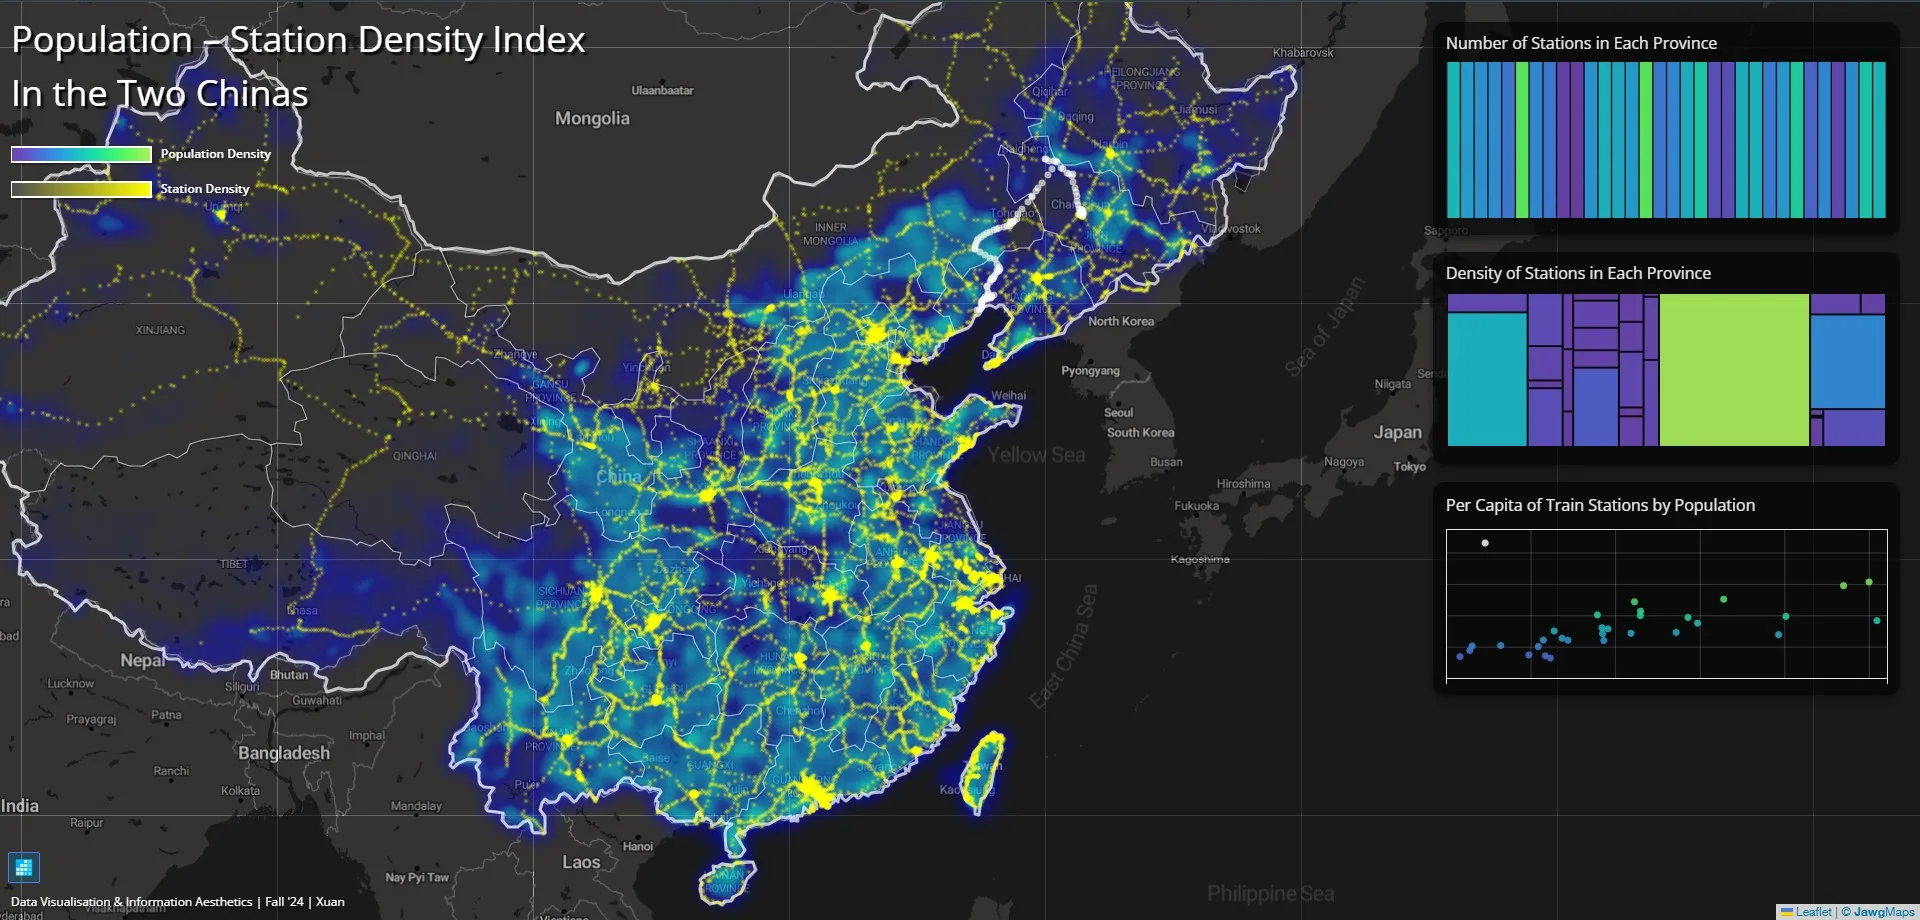
Density Index Map
Population-Train Station Density Index in the Two Chinas
Infographics
Sea of Life
Back to Top