Joyplot
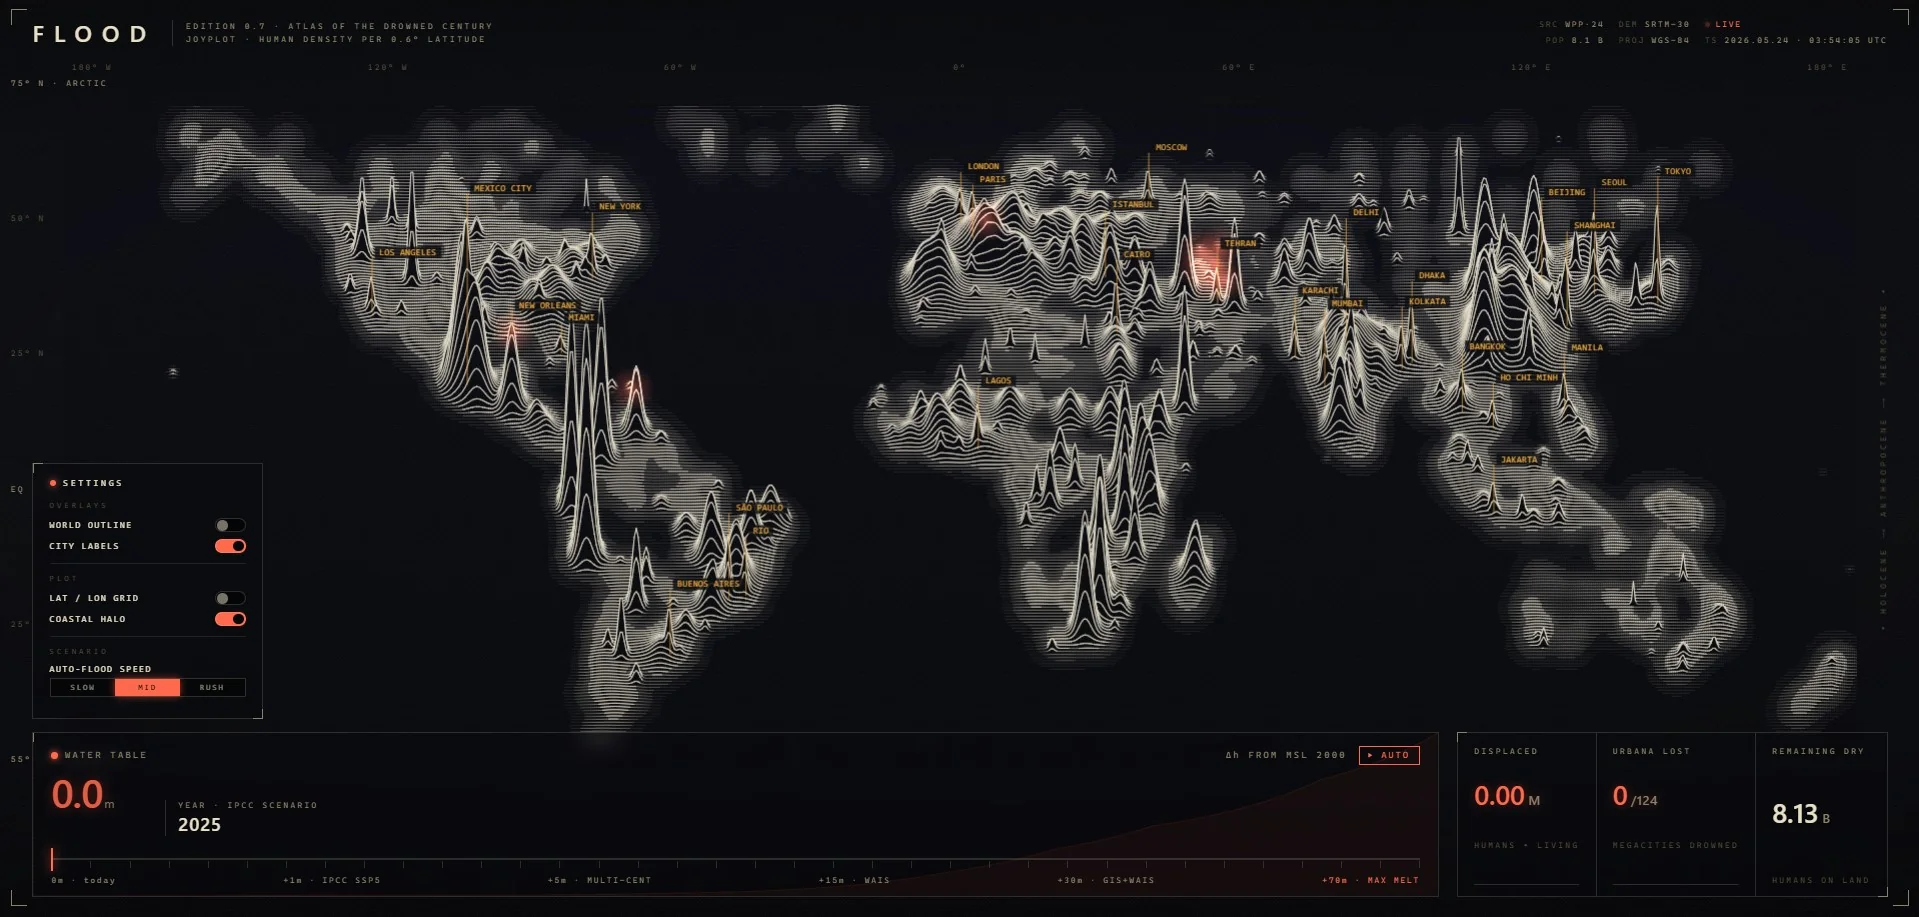
Flood: Atlas of the Drowned Century
Year
2025
Category
Data Visualisation
Medium
Joyplot
Location
Global
A joyplot visualisation of global population density across latitude bands, overlaid against a rising sea-level slider that simulates coastal inundation from 0 to 70 metres. Combining UN urbanisation figures, elevation models, and climate-calibrated projections, the work renders a speculative atlas of the drowned century — mapping which regions face demographic collapse and which remain habitable as the oceans rise.