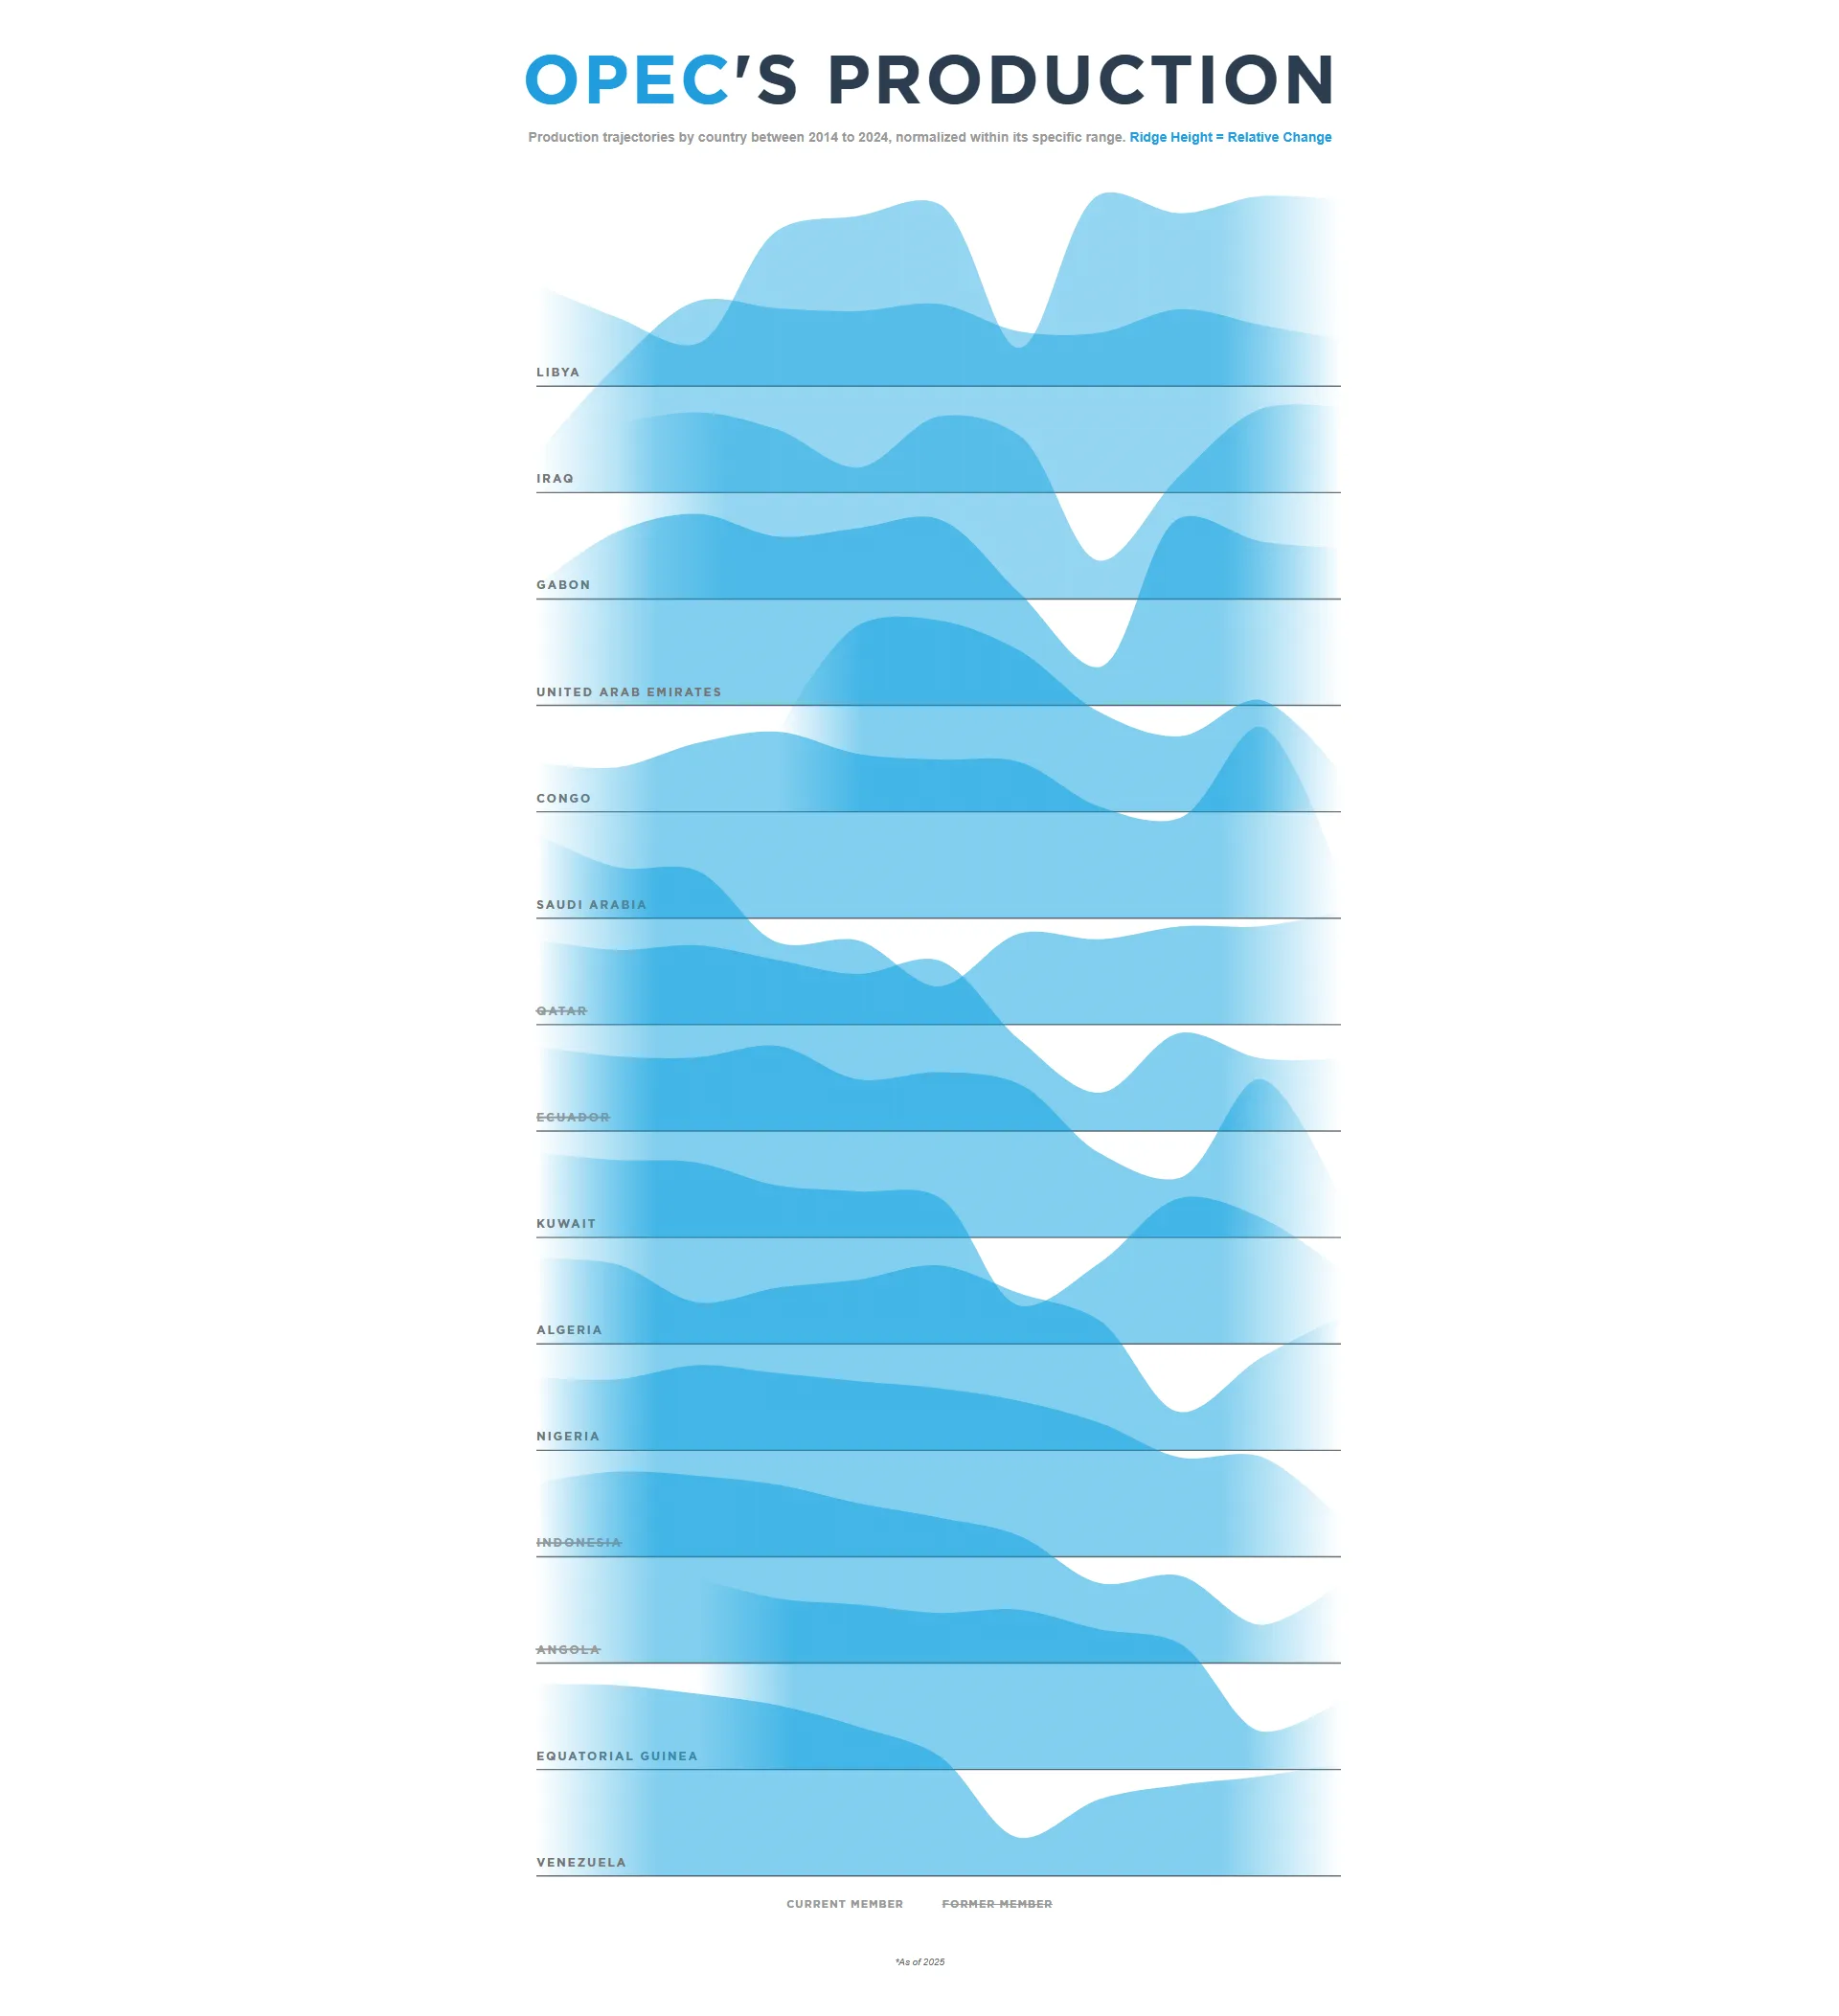
Ridgeline Plot
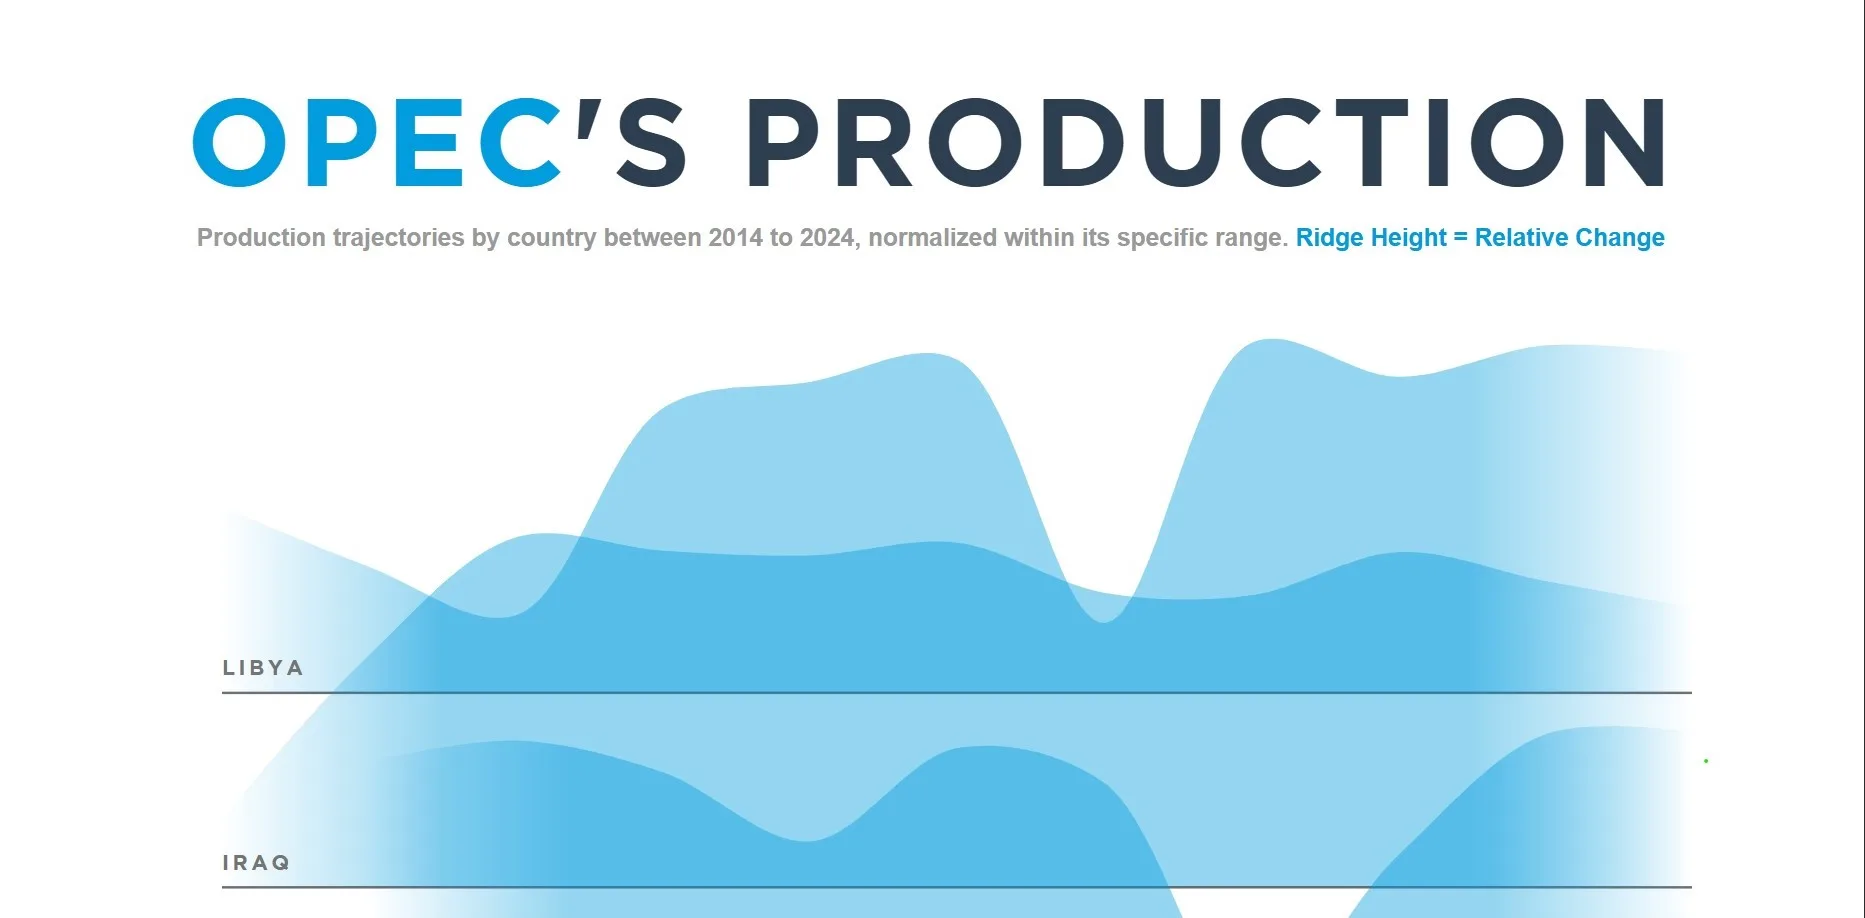
OPEC's Production
Year
2024
Category
Data Visualisation
Medium
Ridgeline Plot
Location
Kuwait City, Kuwait
A ridgeline plot visualisation of oil production amongst OPEC's former and current member states over time. The stacked density curves reveal how production quotas, geopolitical crises, and membership changes have reshaped the cartel's output — rendering decades of energy politics in a single, readable chart.