Interactive Visualisation / Open Data
Singapore Patchwork
Year
2026
Category
Data Visualisation
Medium
Interactive Web Quilt
Location
Singapore
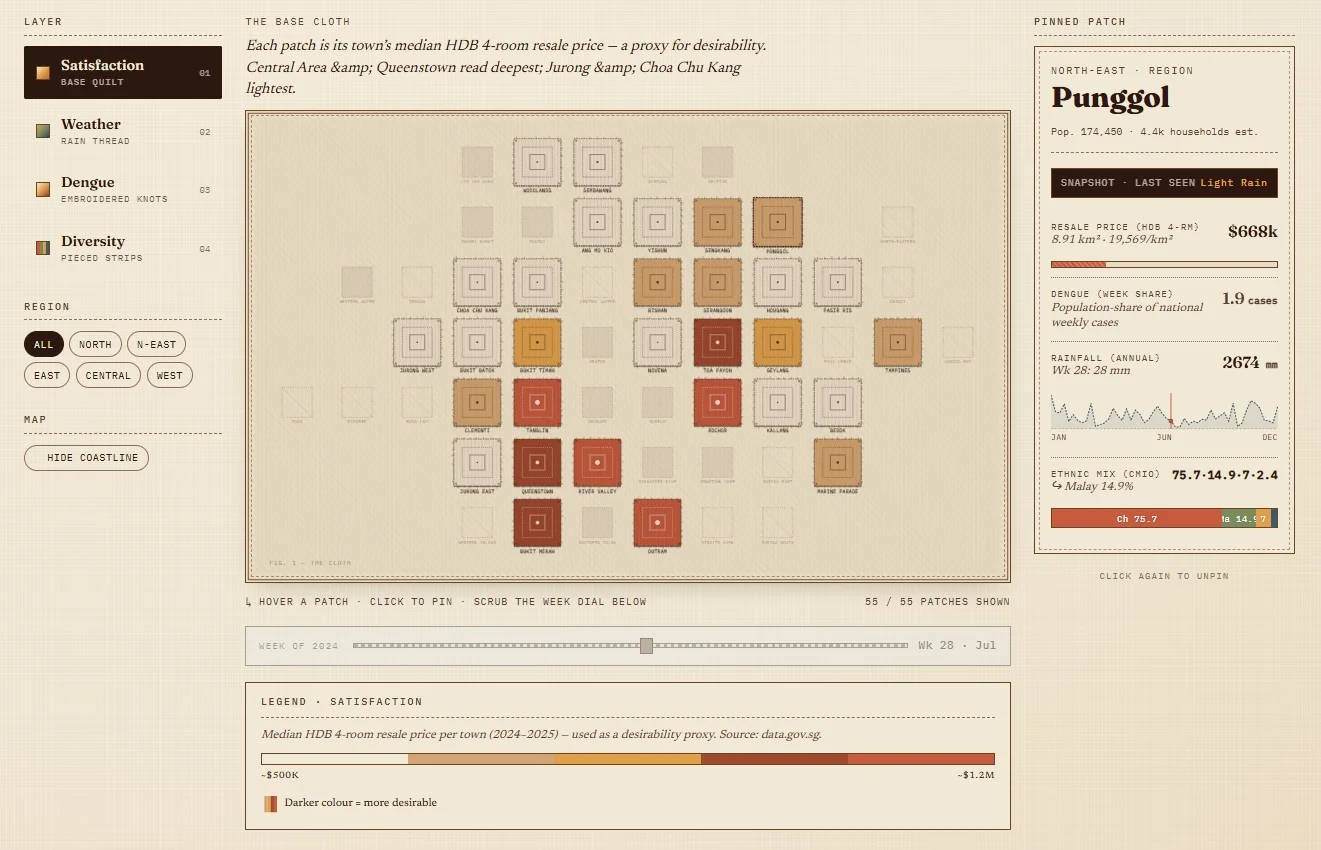
An editorial interactive visualisation that renders Singapore's 55 planning areas as hand-stitched patches on a grid — four open-data layers (HDB 4-room resale prices, weekly rainfall, dengue case distribution, and ethnic composition) co-exist on the same fabric. Patch colours, patterns, and embroidered details encode each town's housing, weather, health, and demographic signatures, inviting readers to see the island as both quantitative and tactile.